Inventory
Inventory is a list of automatically discovered real-time up-to-date enterprise equipment.
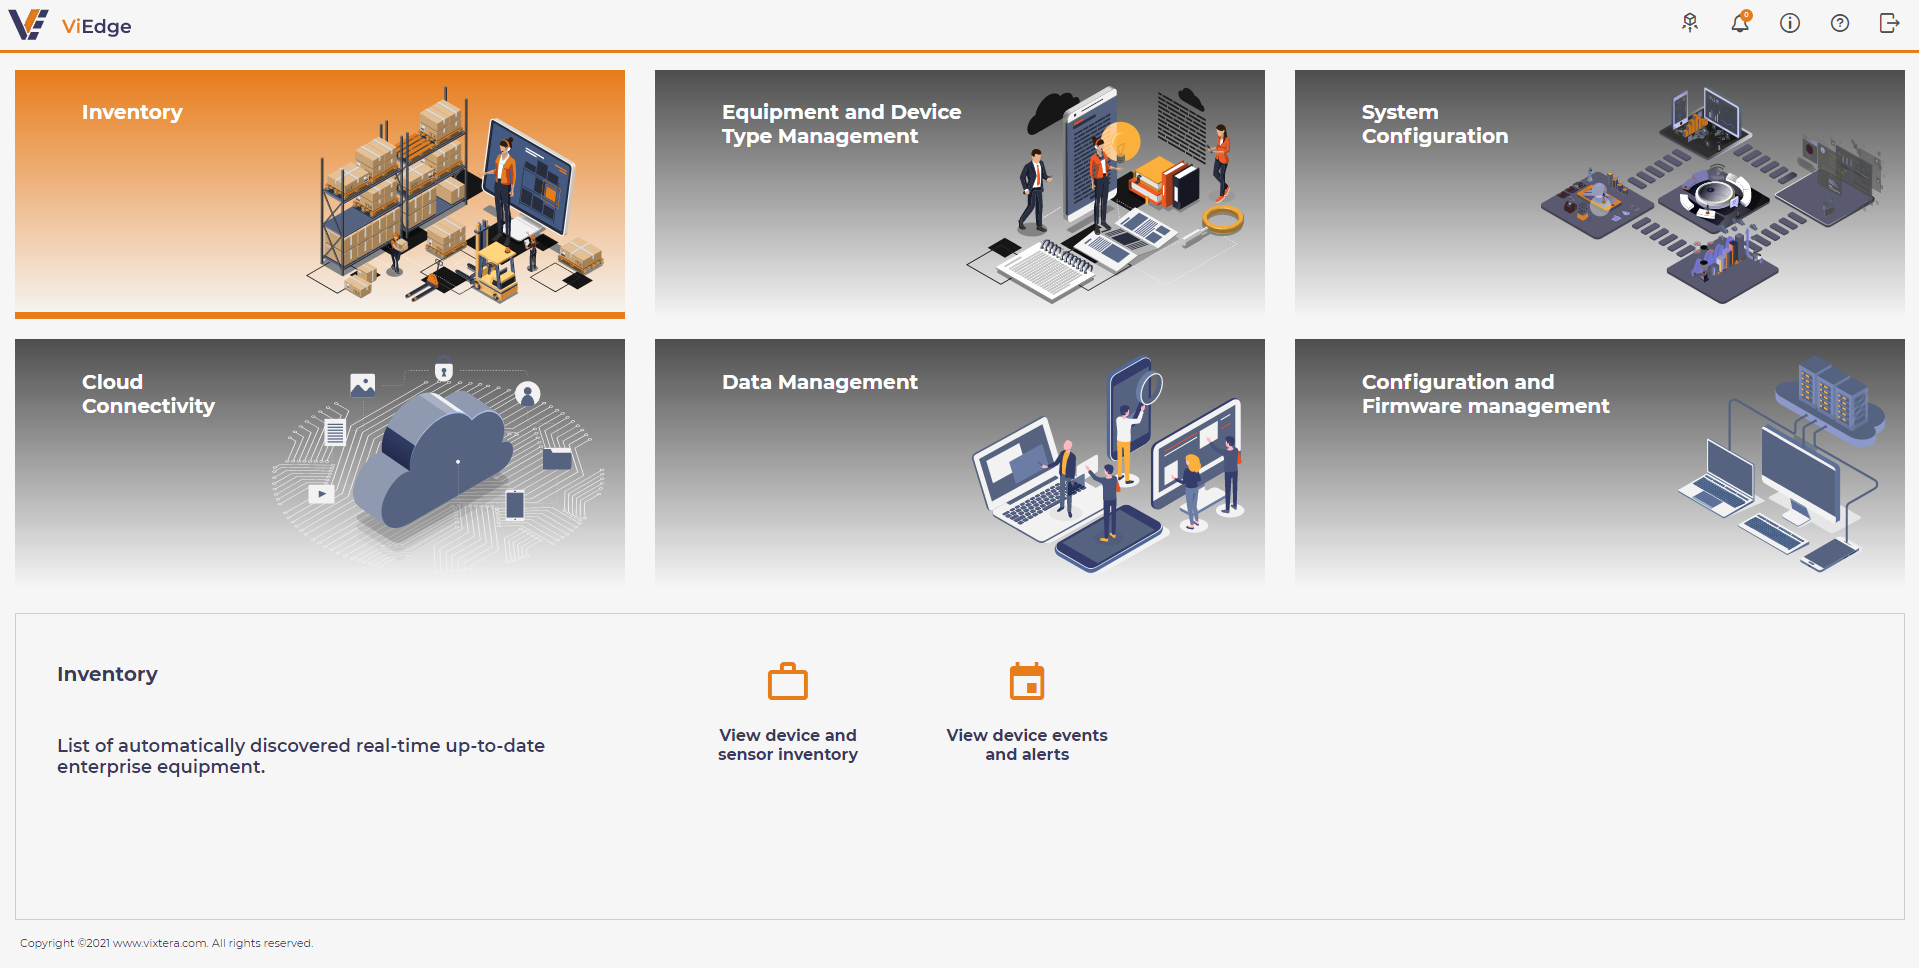
Previously discovered devices are available by selecting View device and sensor inventory icon.
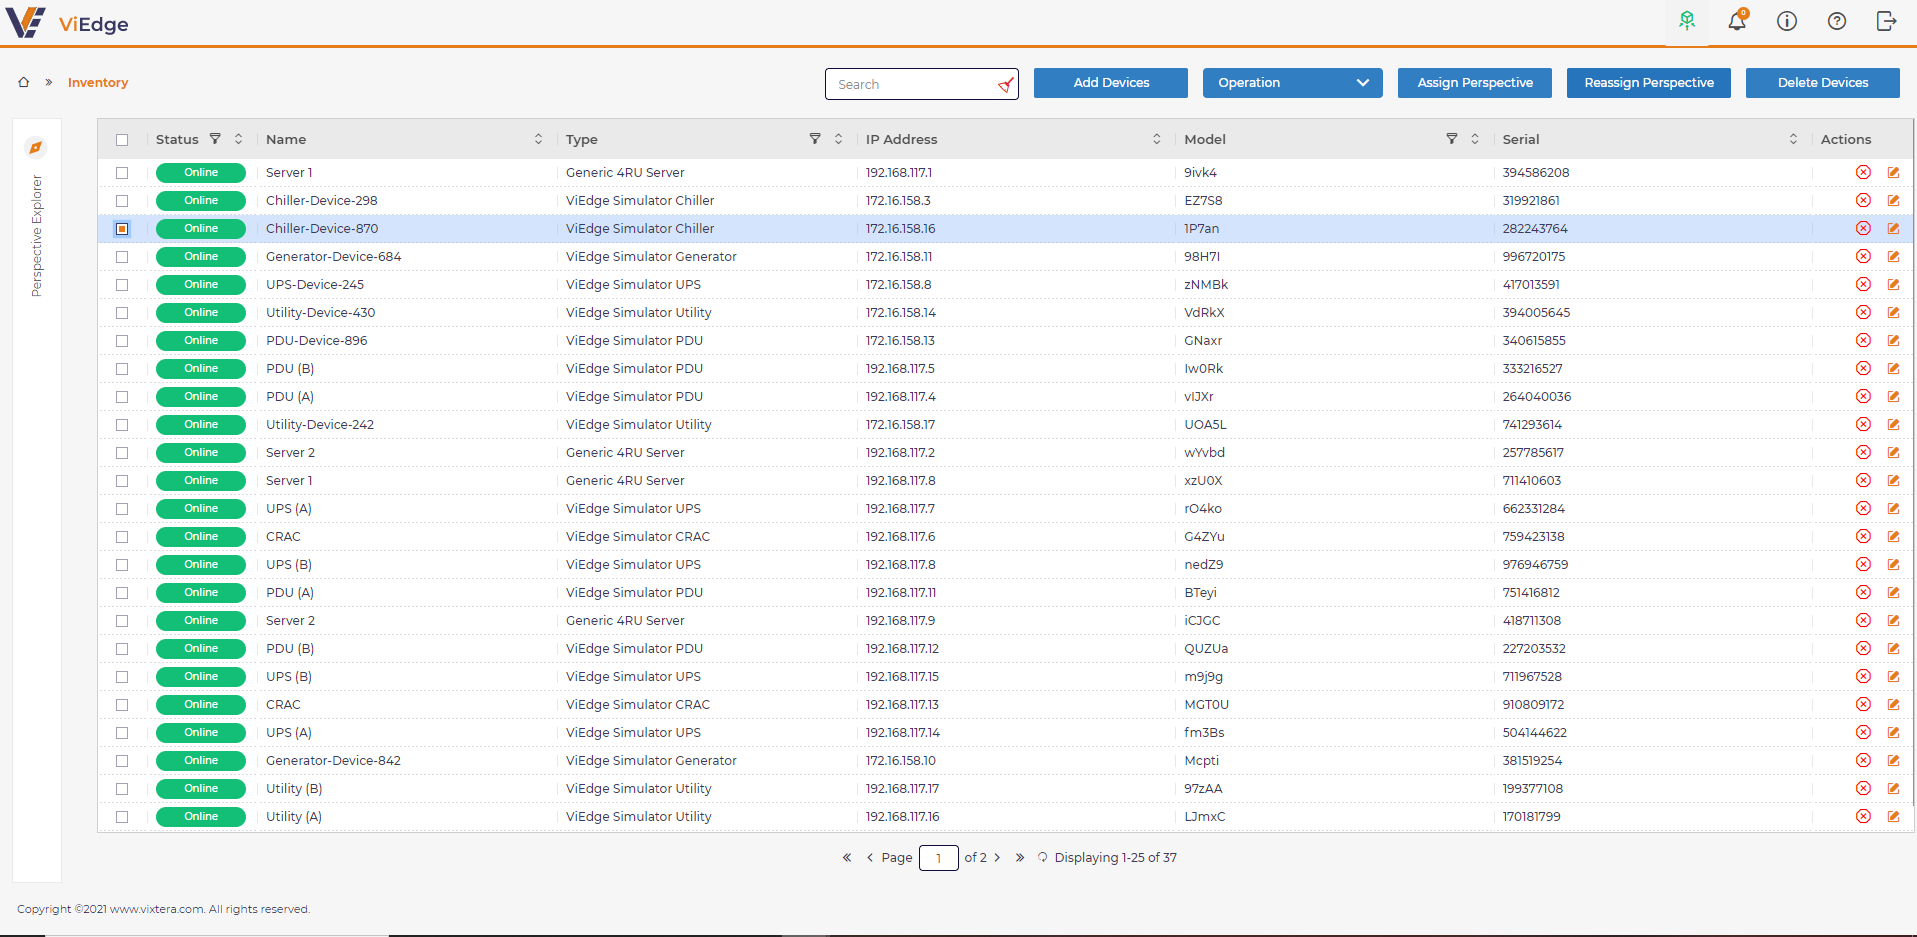
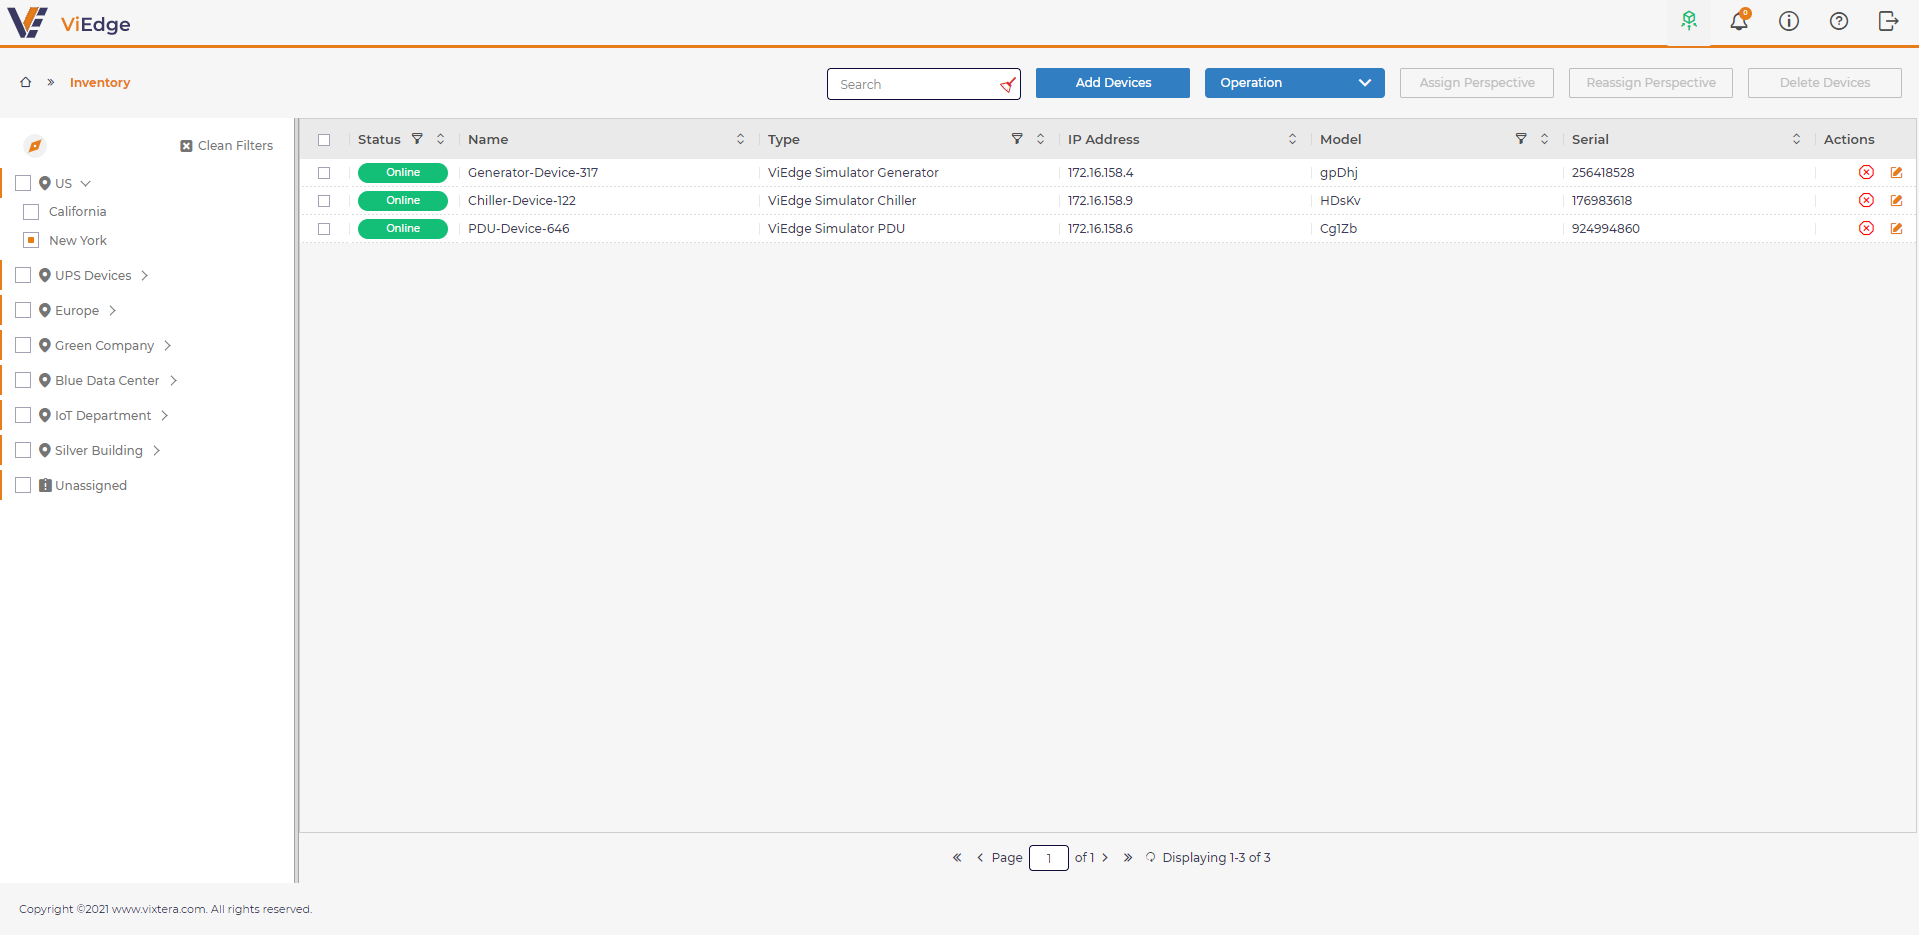
Inventory View
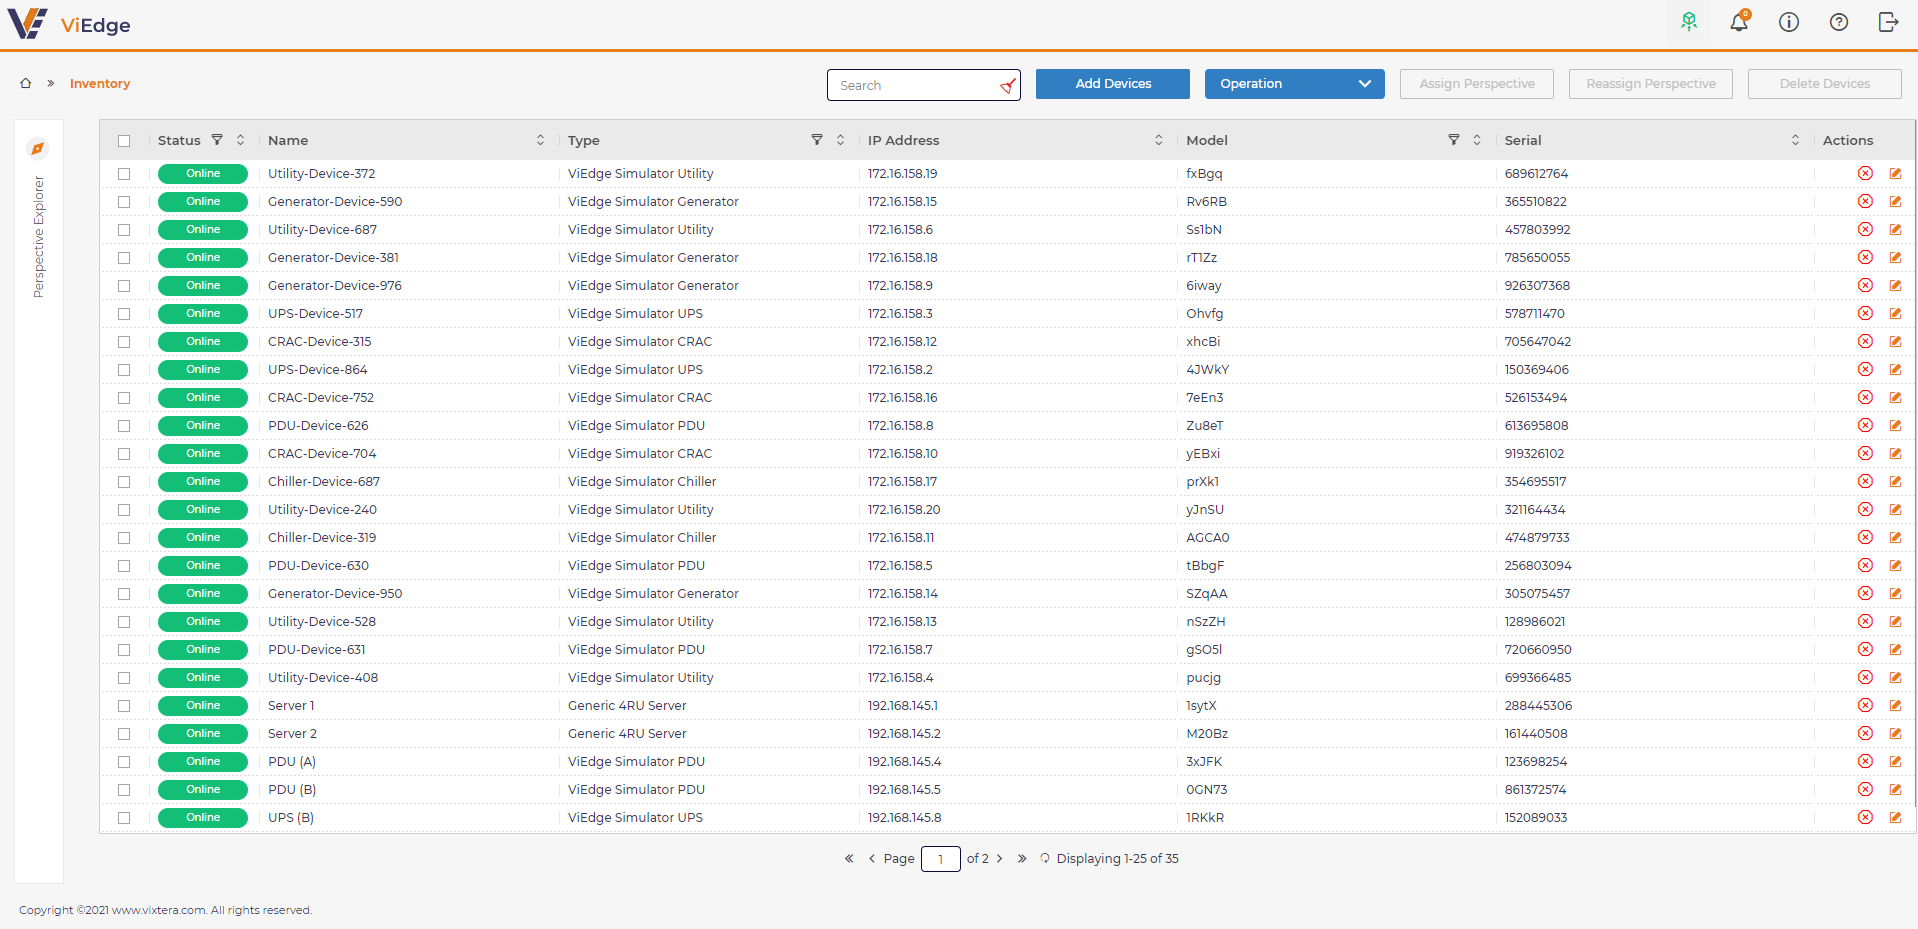
There are next columns at the Inventory view:
-
Status
-
Name
-
Type
-
IP address
-
Model
-
Serial
-
Actions:
-
Delete
-
Edit
-
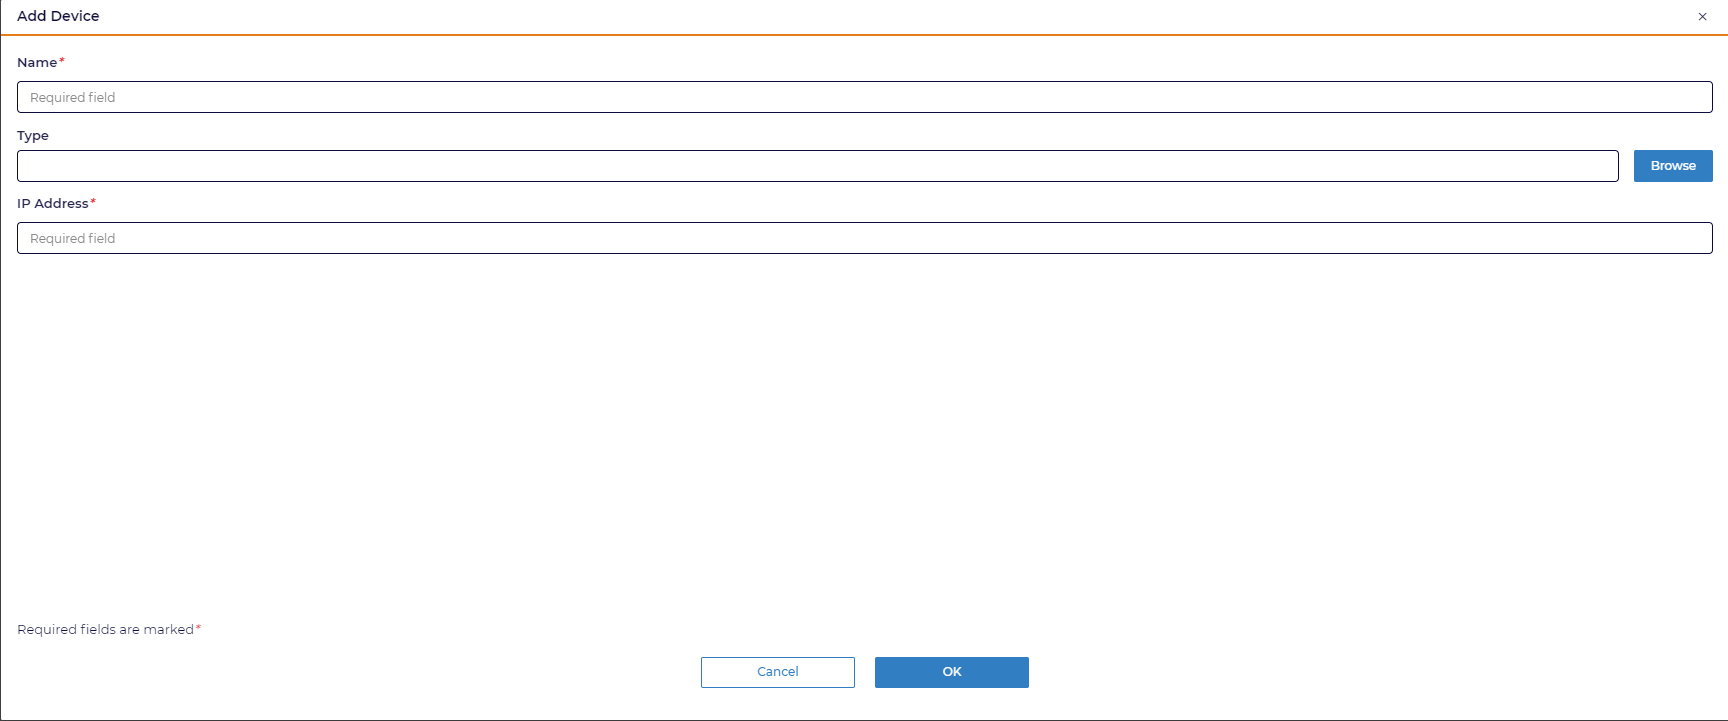
Add device
To add a new device into Inventory a user should:
1 Click Add Device and populate required fields
-
Name
-
IP address
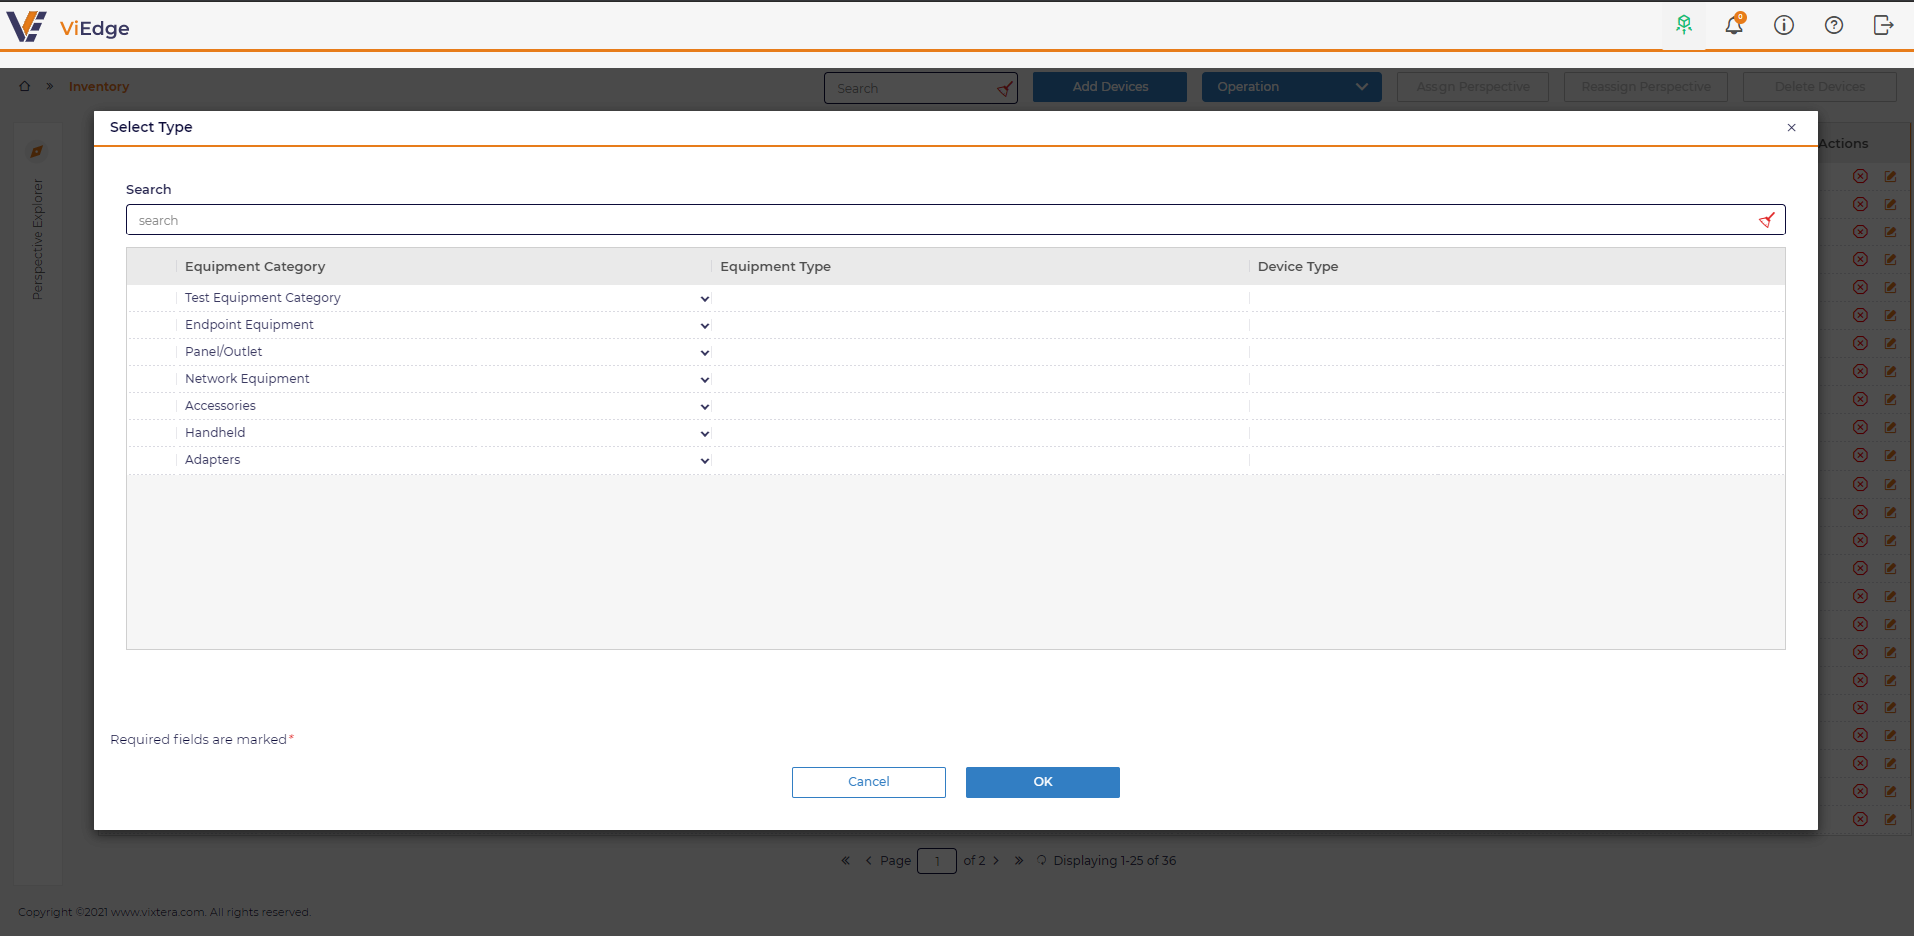
Device type is a not mandatory field. However, if a user knows a type, one can chose by using search at Select Type dialog
After saving the dialog, a new device with status Modeled appears at the grid:
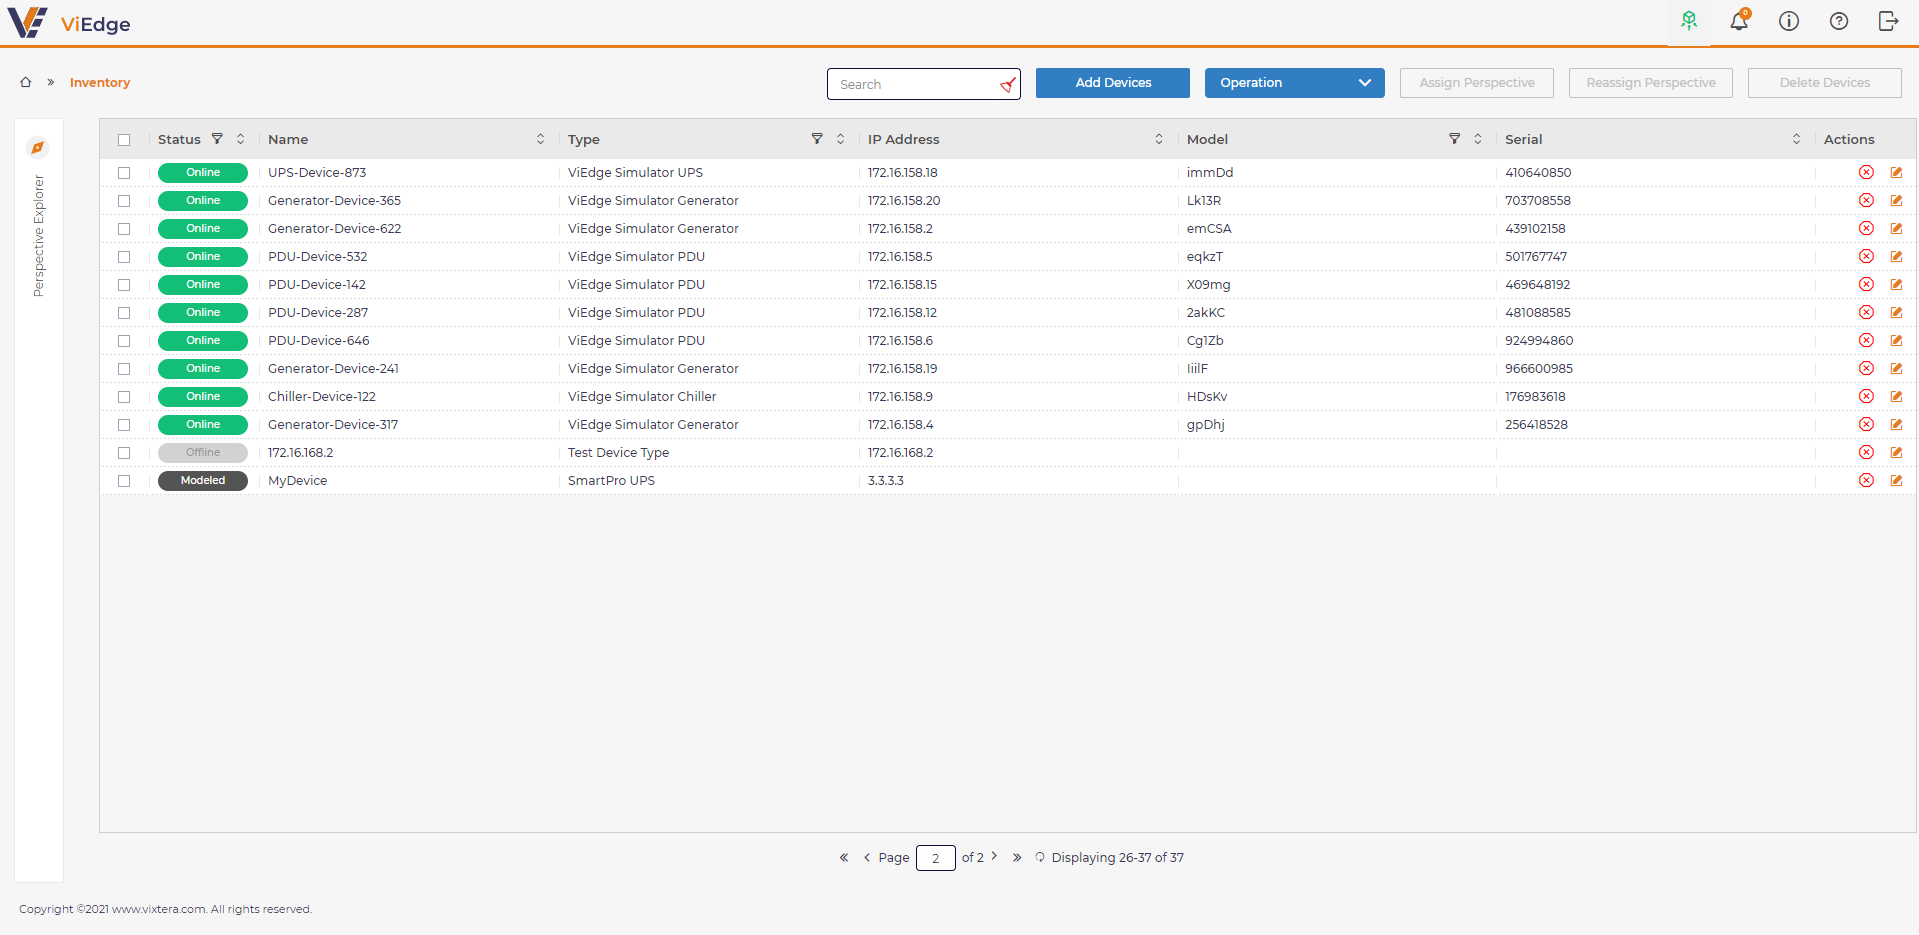
See Device Statuses for reference.
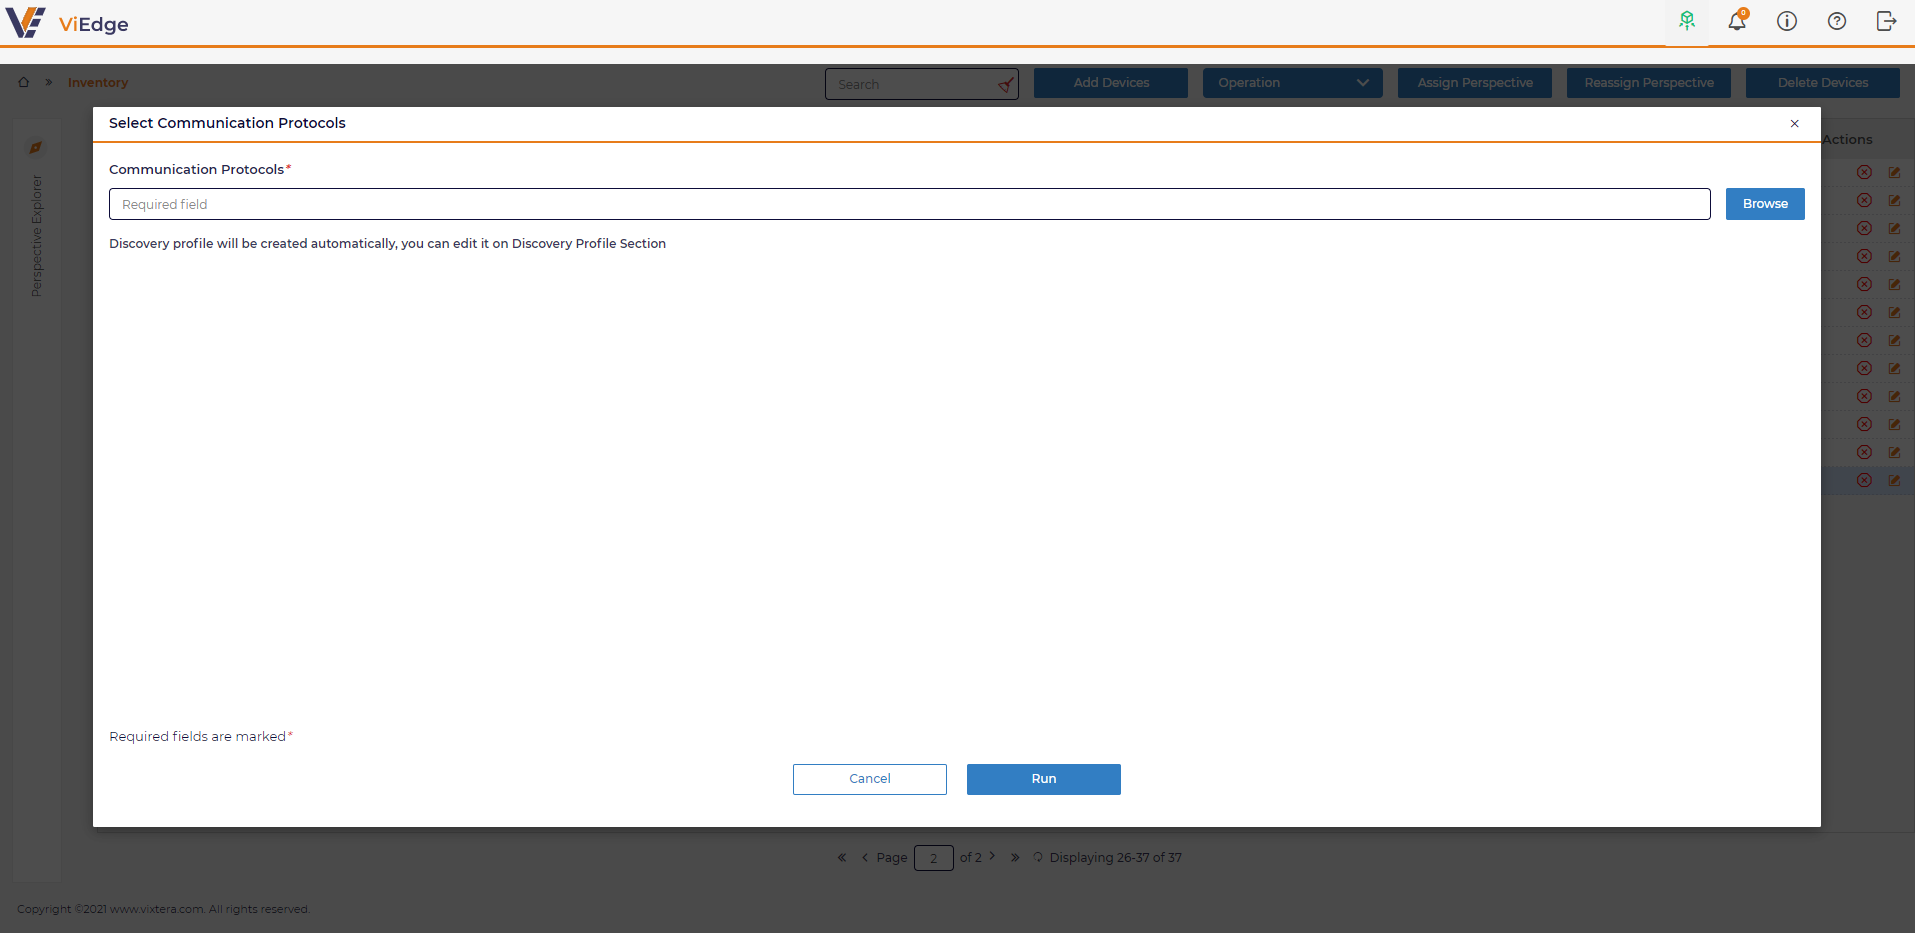
2 Execute Discovery operation.
By selecting a device, Discovery operation is available to be run.

By clicking Discovery a user prompts to select a communication protocol:
By saving a dialog, the discovery operation starts, and a validation message appears:
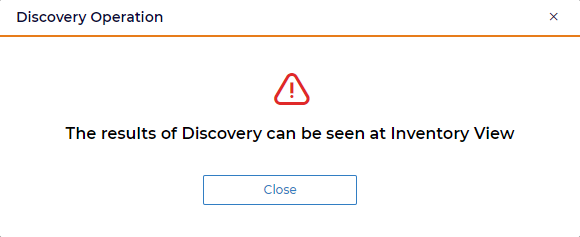
The ongoing process of Discovery can be monitored at Activity.
The results of discovery can be viewed at Inventory View.
A user can also view the operation activity details in Logs.
Operations
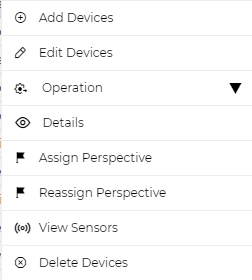
A user is able to run next operations from a button ribbon or in a right click menu (RCM).
-
Discovery
-
Poll data
-
Get configuration
-
Firmware update
-
Configuration update
-
Execute command
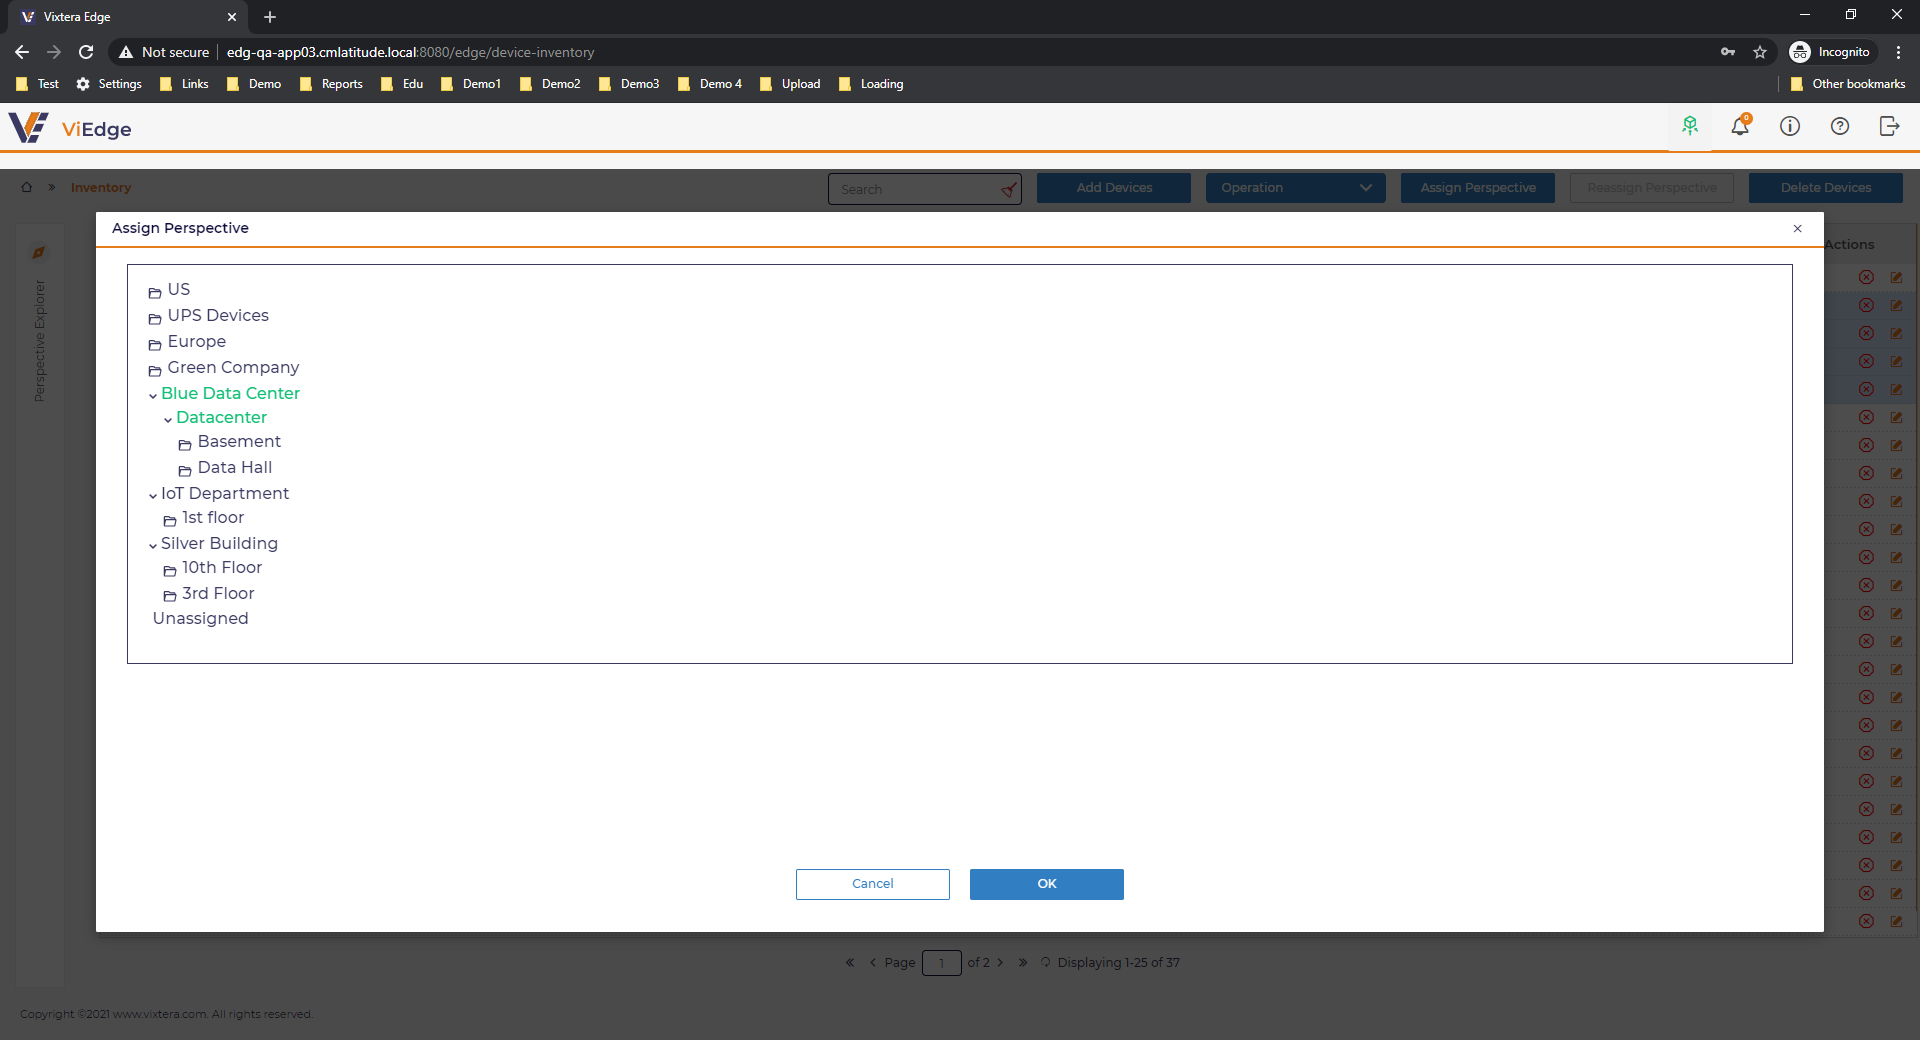
Assign Perspective
A user is able to make a logical grouping used to classify devices and define categories.
A user should select one or any number of devices and click Assign Perspective.
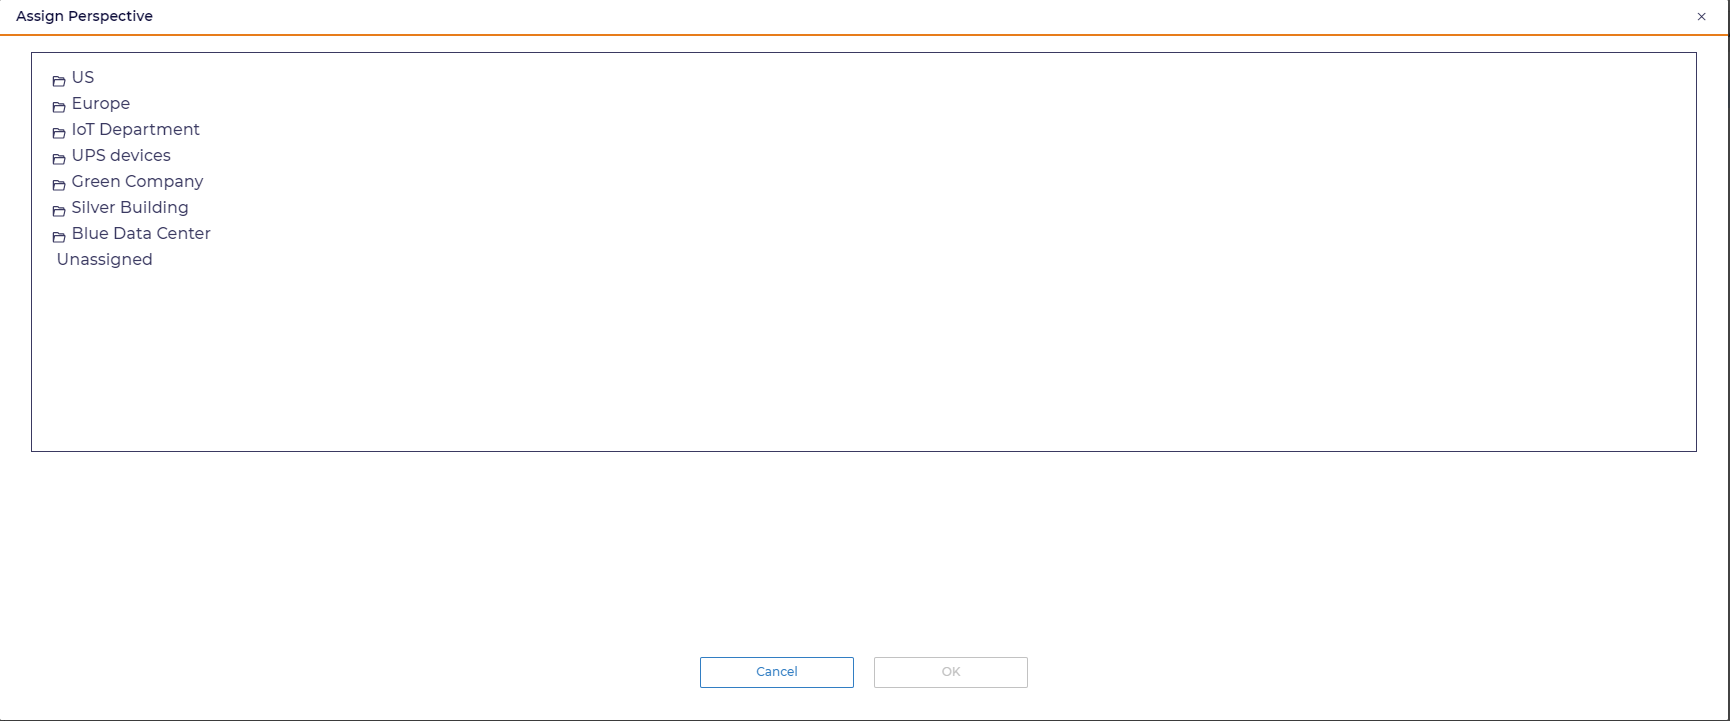
A user should select a perspective and click OK:
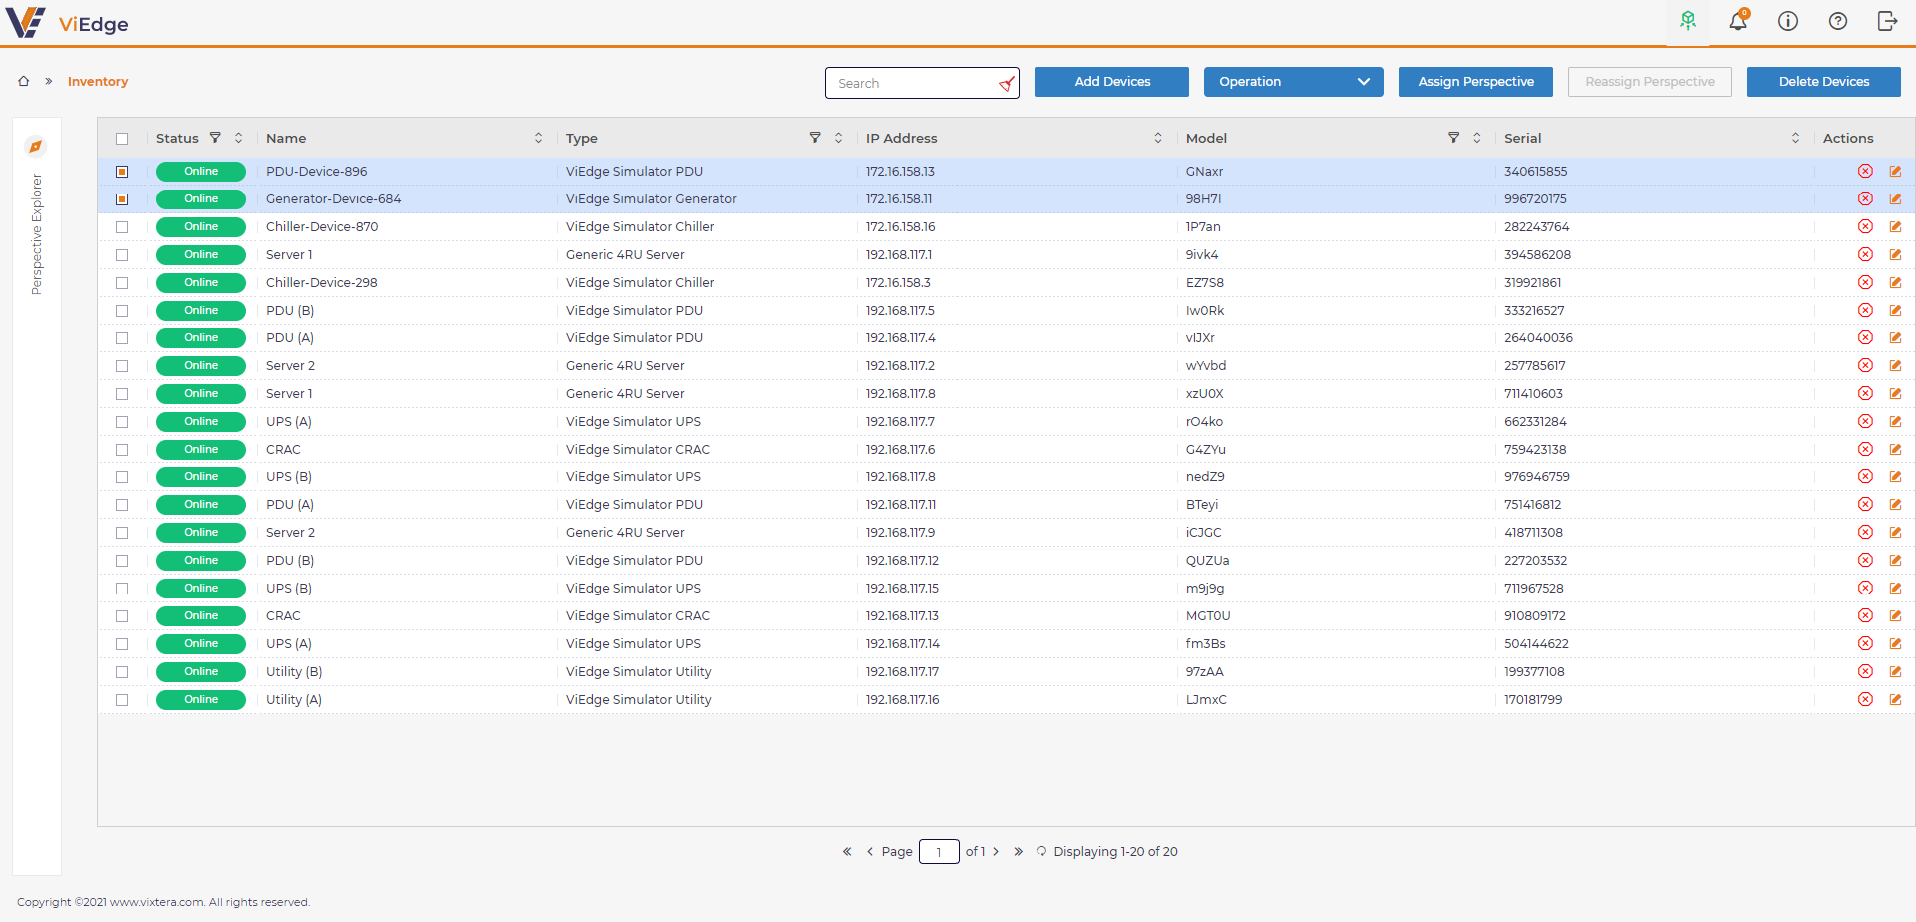
A user is able to remove a device from the assigned perspective by using Reassign Perspective button.
However, Reassign Perspective is disabled for bulk delete to avoid an error.
Perspective Explorer
Perspective Explorer provides ability to view devices assigned to different perspectives or unassigned.
By default, Perspective Explorer is rolled up. To expand it, a user should select:
Expanded view of Perspective Explorer:
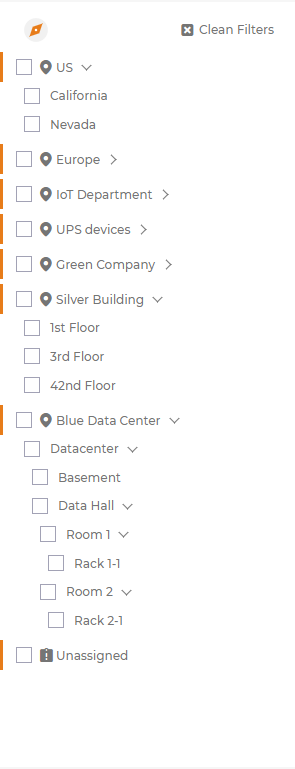
To filter devices in Inventory, a user should select a required perspective:
To close it, a user should also select it:
Device Statuses
Device inventory supports next statuses:
-
Online - the device is up
-
Offline - the previously discovered device is not responding
-
In Service - the device is updating the configuration or firmware
-
Outdated - the device protocol is changed by a user, a re-discovery required
-
Modeled - the device is added manually by a user, a discovery required
Right Click Menu
A user is able to select an operation or other option to work with a device using right click menu:
View Sensors
A user is able to view the data polled from device sensors as a graph.
A user should choose a required device, select right click menu and choose View sensors.
Device sensors view appears. By default, no sensor is selected and no graph is presented.
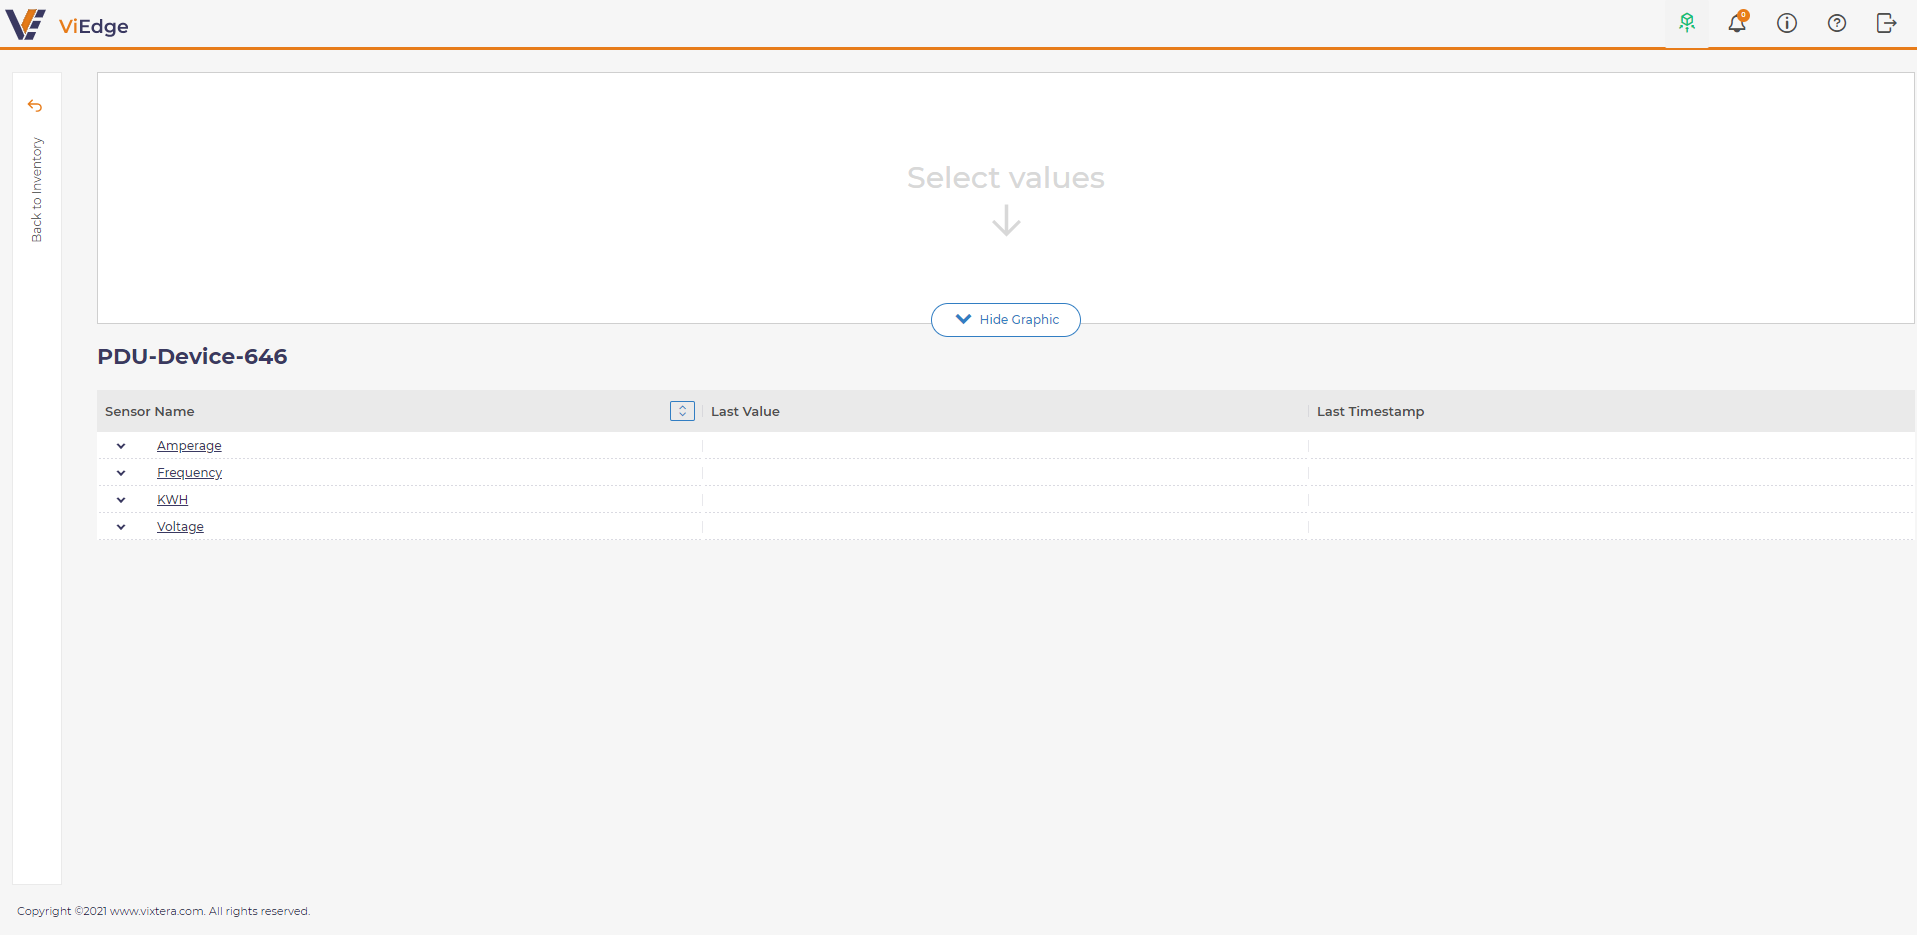
To view sensor data, a user should expand a required parameter name and select a sensor or sensors:
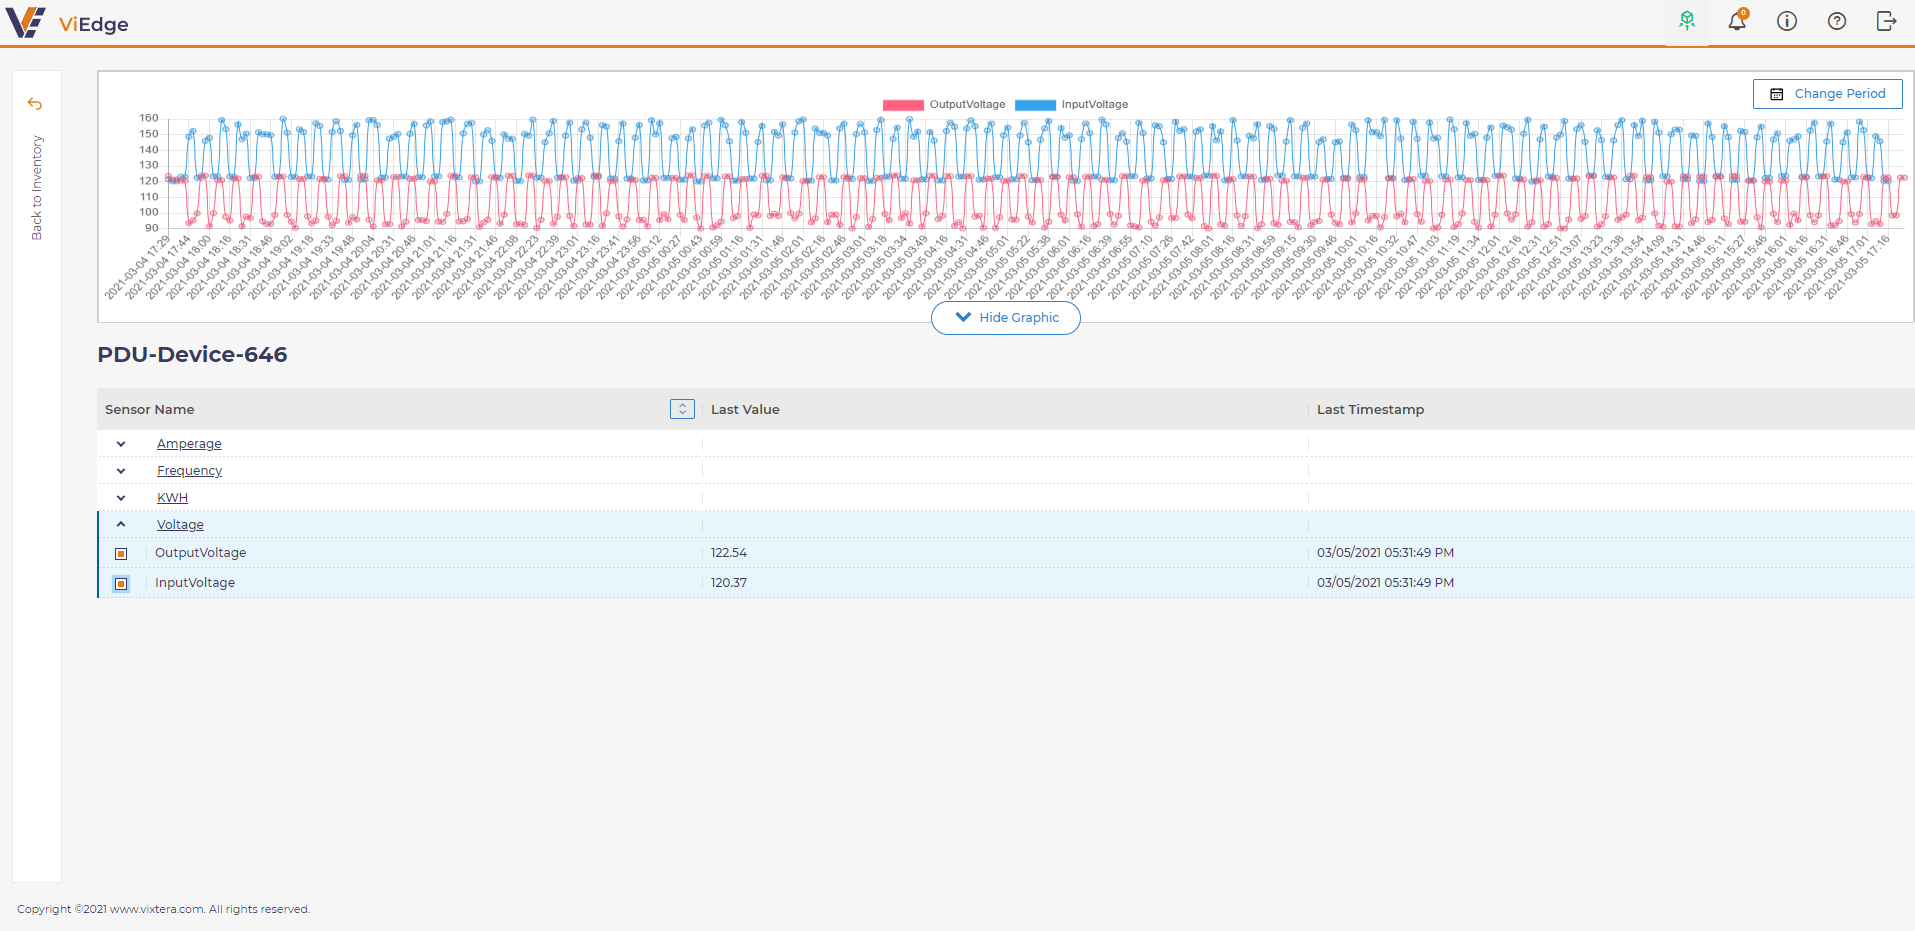
A user is able to change a time period by selecting Change Period filter.
Events
Device sensors send events, and a user is able to view them.
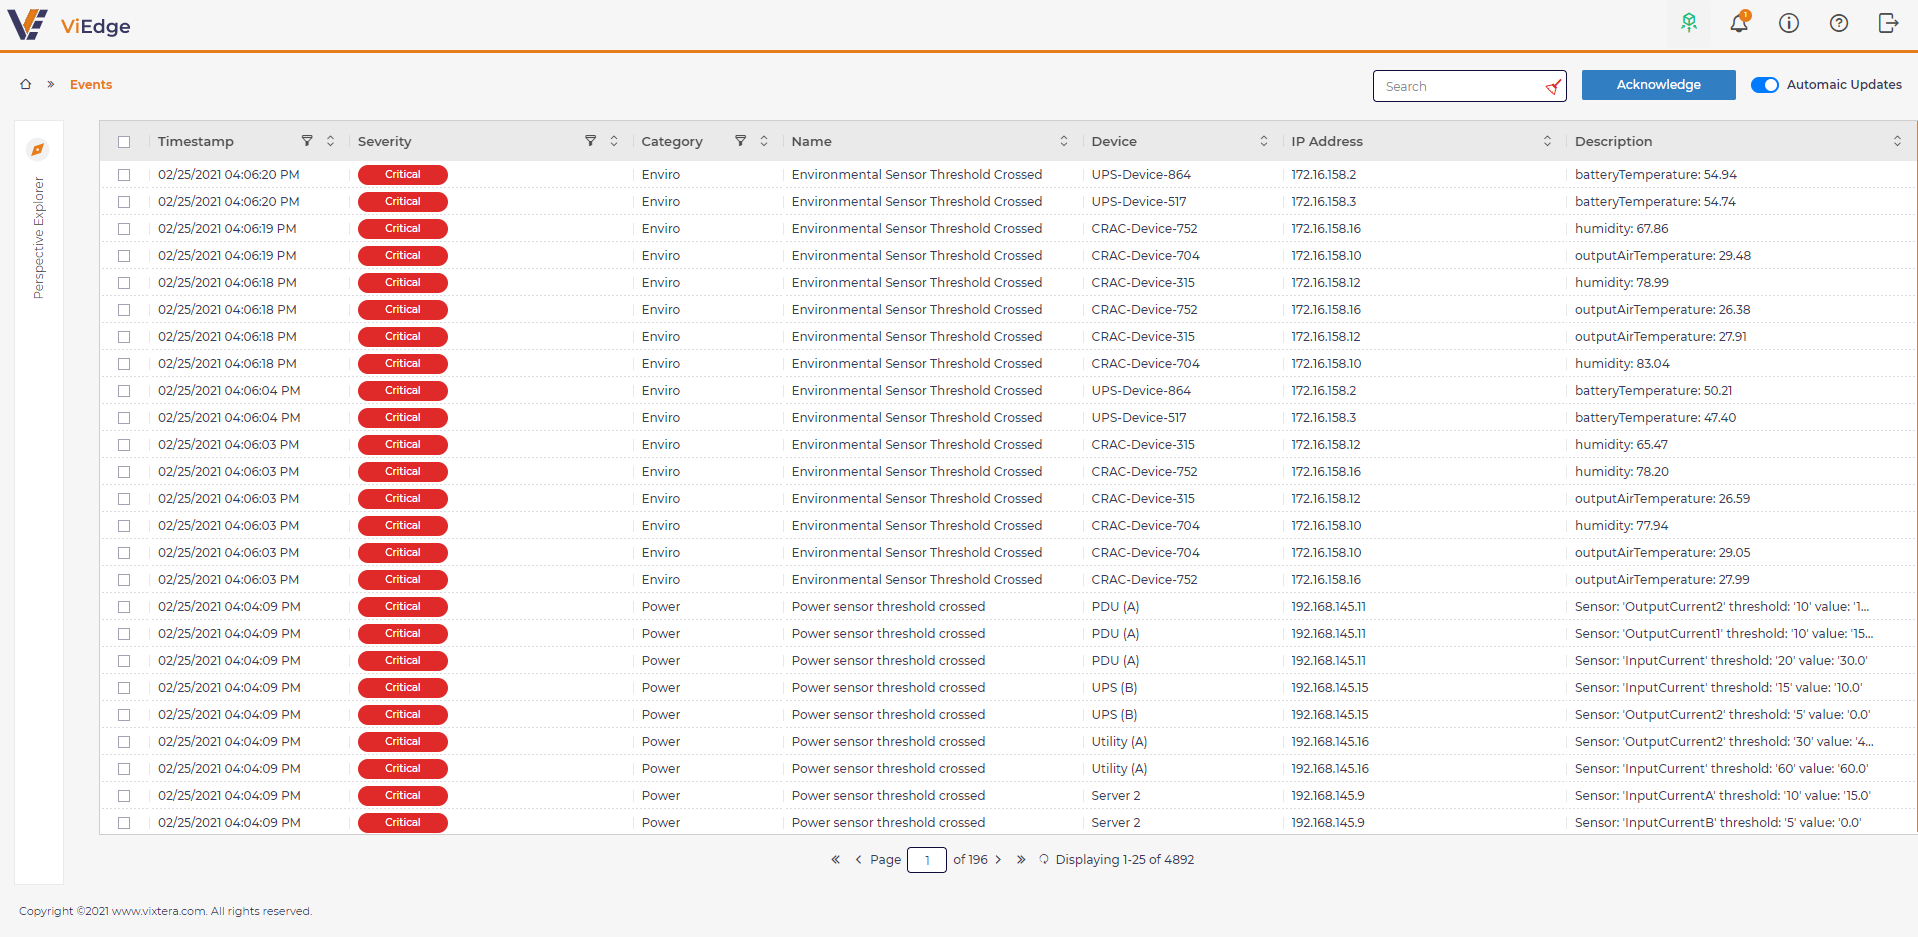
Next severity types are supported:
-
Critical
-
Major
-
Normal
-
Minor
-
Info
You may filter the events using:
-
Perspective explorer
-
By time range
-
By severity
-
By category
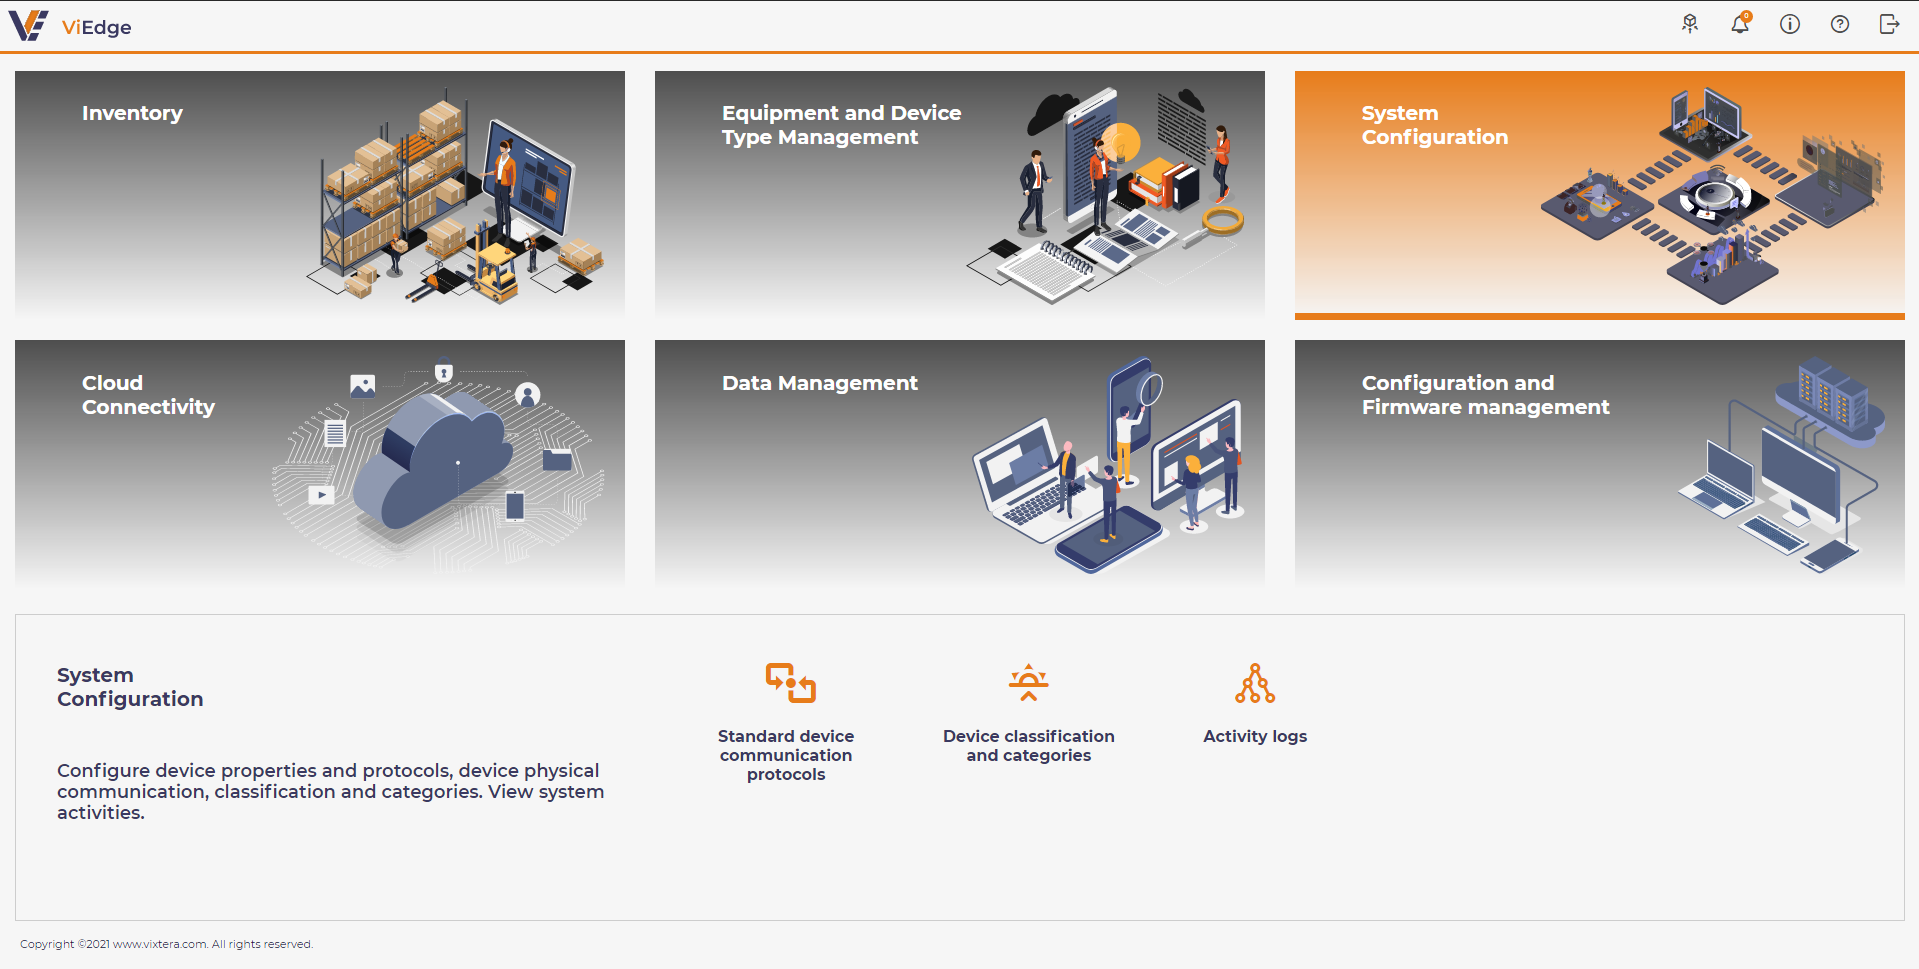
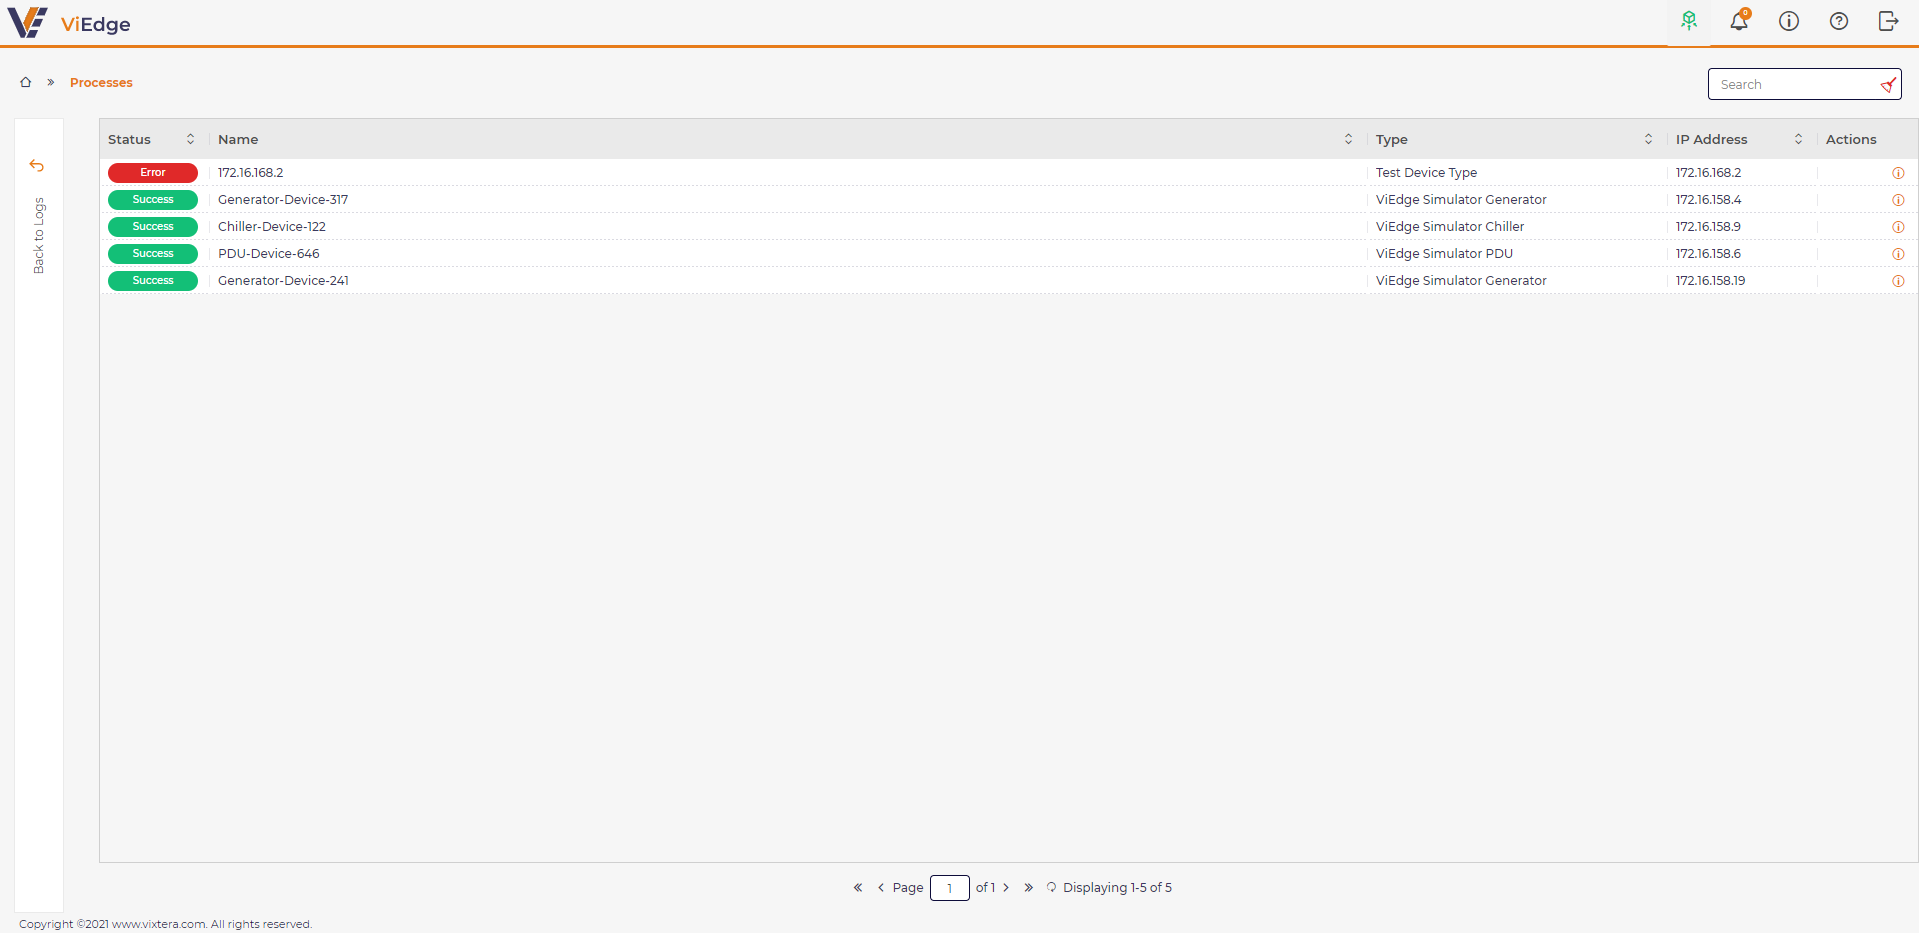
Logs
You may check log information at Activity logs in System Configuration
Activity logs view:
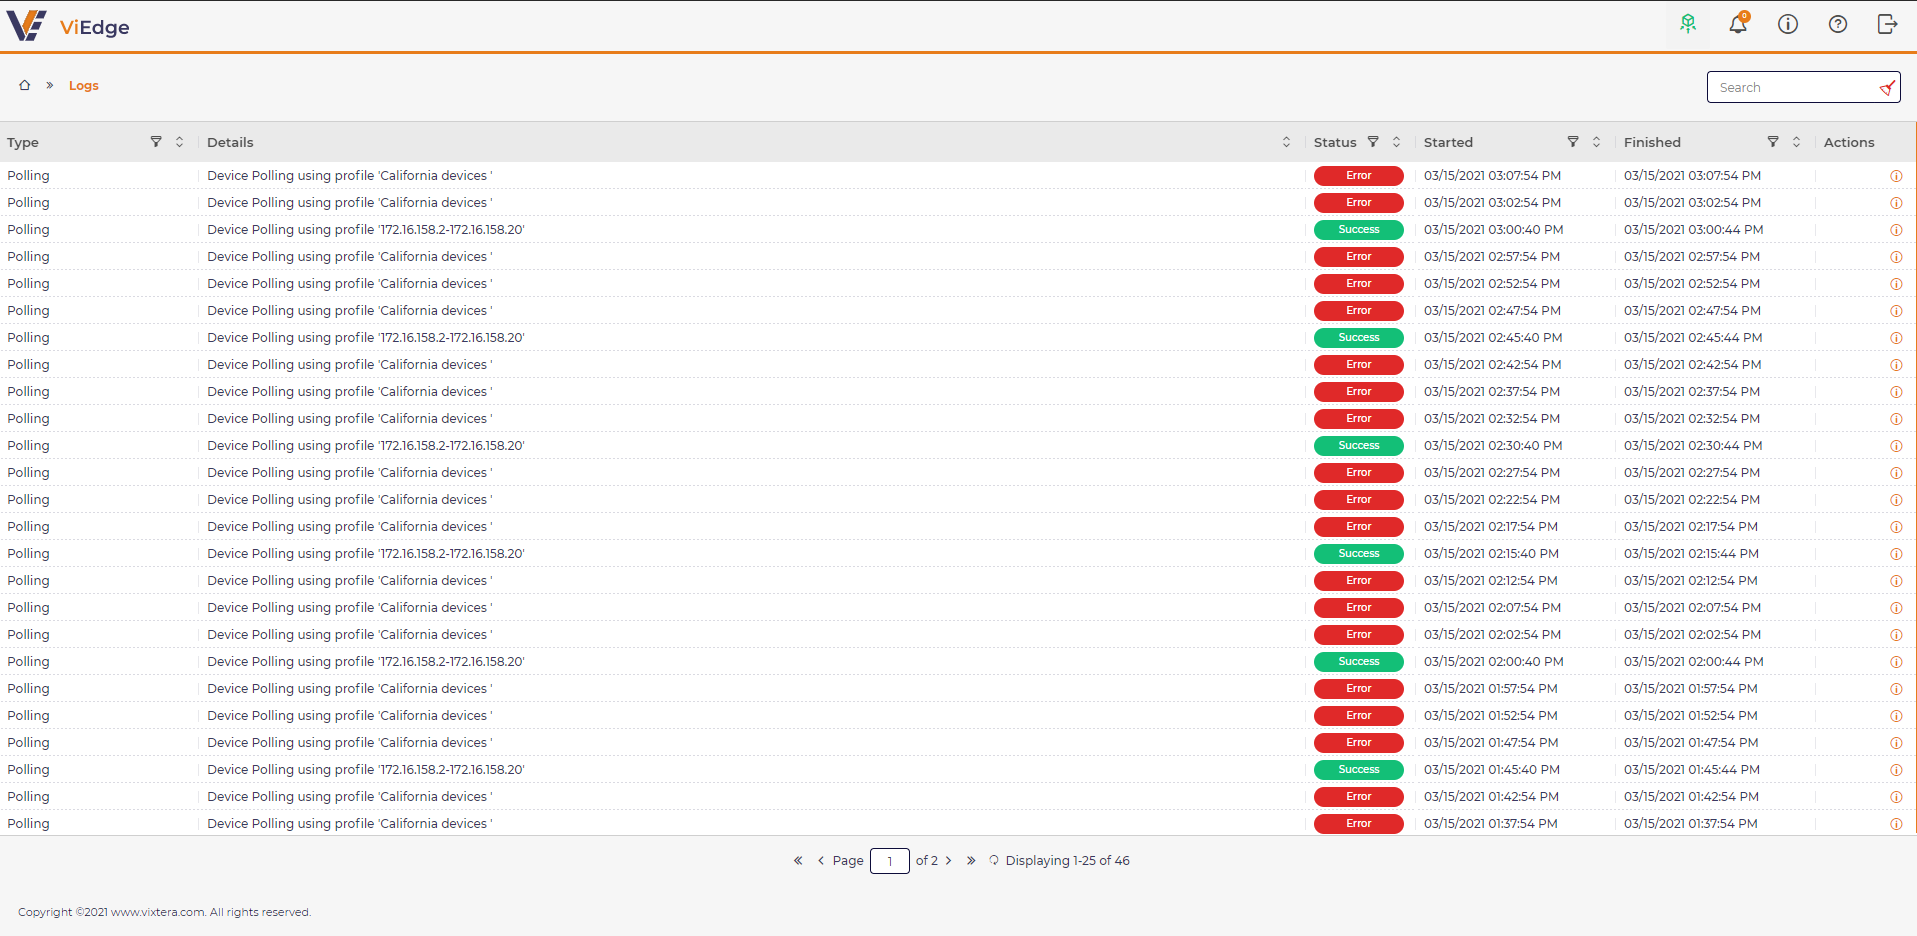
There are next columns at Logs view:
-
Type
-
Details
-
Status
-
Started
-
Finished
-
Actions
You may filter the events by:
-
Type:
-
Discovery
-
Configuration update
-
Firmware update
-
Import configuration
-
Polling
-
Publishing
-
Analytics
-
-
Status:
-
Success
-
Error
-
-
Time range
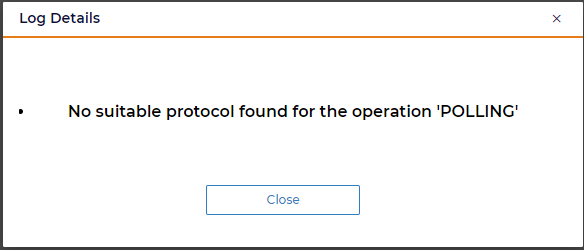
There are two levels of logs. The first level of details are presented at Logs view. To check the second level of logs, you need to select:
in the Actions column.
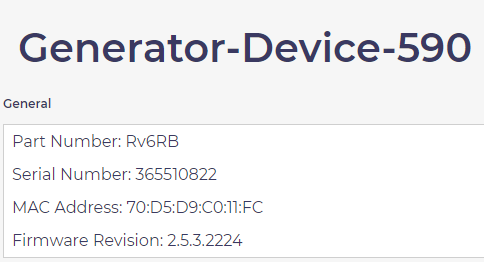
To check the device details, a user should select
An information message with specific device details appears, for example:
Data curation
While collecting data from industrial devices, the large amount of it is incoherent, irrelevant and is practically useless.Besides, overwhelming network with flawed information, it does create enormous challenges for real-time and predictive analysis. Curating data at the edge resolves significant issues exposed by bandwidth and latency.However, it often involves algorithmic complexity that requires high-performing computing systems to process.
Data curation is the organization and integration of data collected from devices that:
-
reduces frequency of transmission and size of transmitted data
-
balances and contextualizes data across sensors, devices and functions
-
tunes & optimizes sensors to minimize the amount of “erroneous” data.
The ViEdge enables multifaceted data curation using innovative correlation algorithm and analysis to filter collected data while classifying its association with sensors, devices and functions.
By default, data curation is disabled in the ViEdge.The data curation icon is located at the right upper corner.

To turn up the correlation algorithm, you should click Data curation icon, and move the slider button to the right position.

The Data curation becomes active:
After a while, data appears at the grid.
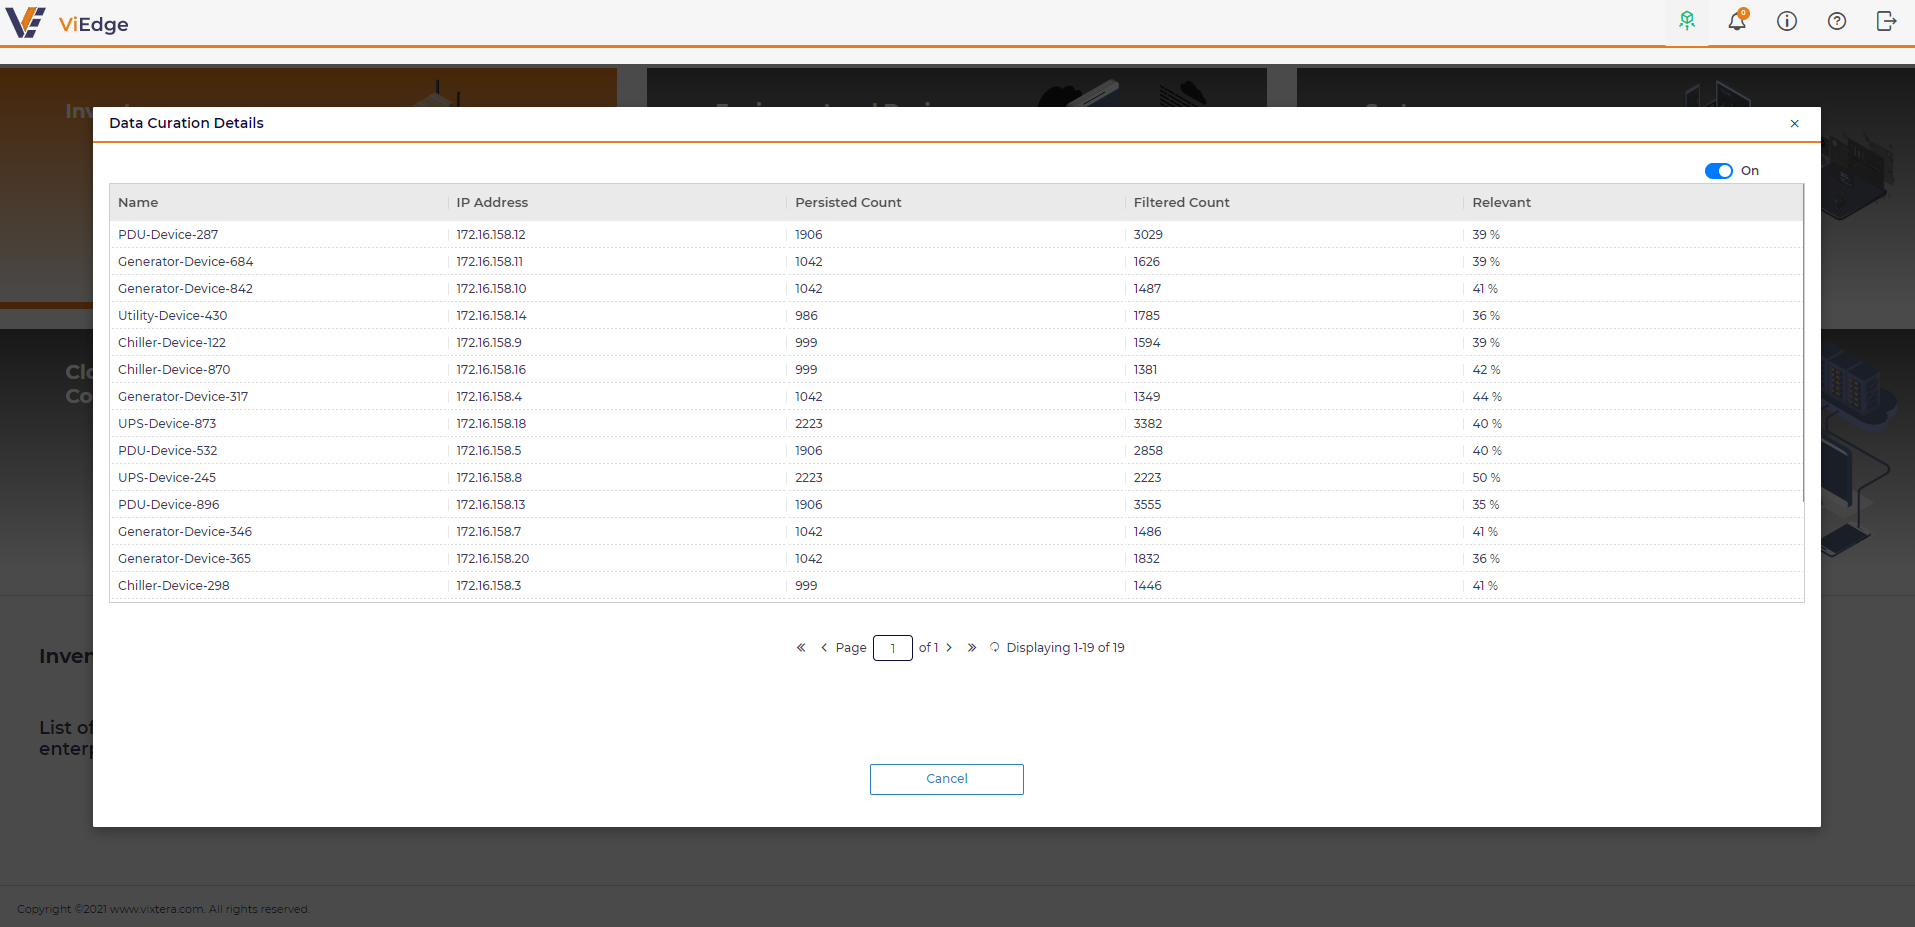
There are next columns:
-
Name of device.
-
IP address (of a device).
-
Persisted Count
-
Filtered Count
-
Relevant
ViEdge data curation algorithm is configured to analyze the data flow within 30 seconds time frame and threshold that equals 10%.
-
Persisted Count that is a number of events that saved in the ViEdge as a result of data curation algorithm work.
-
Filtered Count that is a number of events that data curation algorithm cleaned.
-
Relevant equals the ratio Persisted Count / (Filtered Count + Persisted Count)) * 100.
As the result a duplication of metadata is eliminated whereas reducing frequency of transmission and size of collected data.
Activity
The ongoing processes in the application can be viewed in Activity dialog.
Activity icon is available at the right upper corner of the application:

A number of active processes is displayed in an orange circle.
Activity view shows process name, start, type, devices (a number of devices), completion, errors and actions (Delete a process).
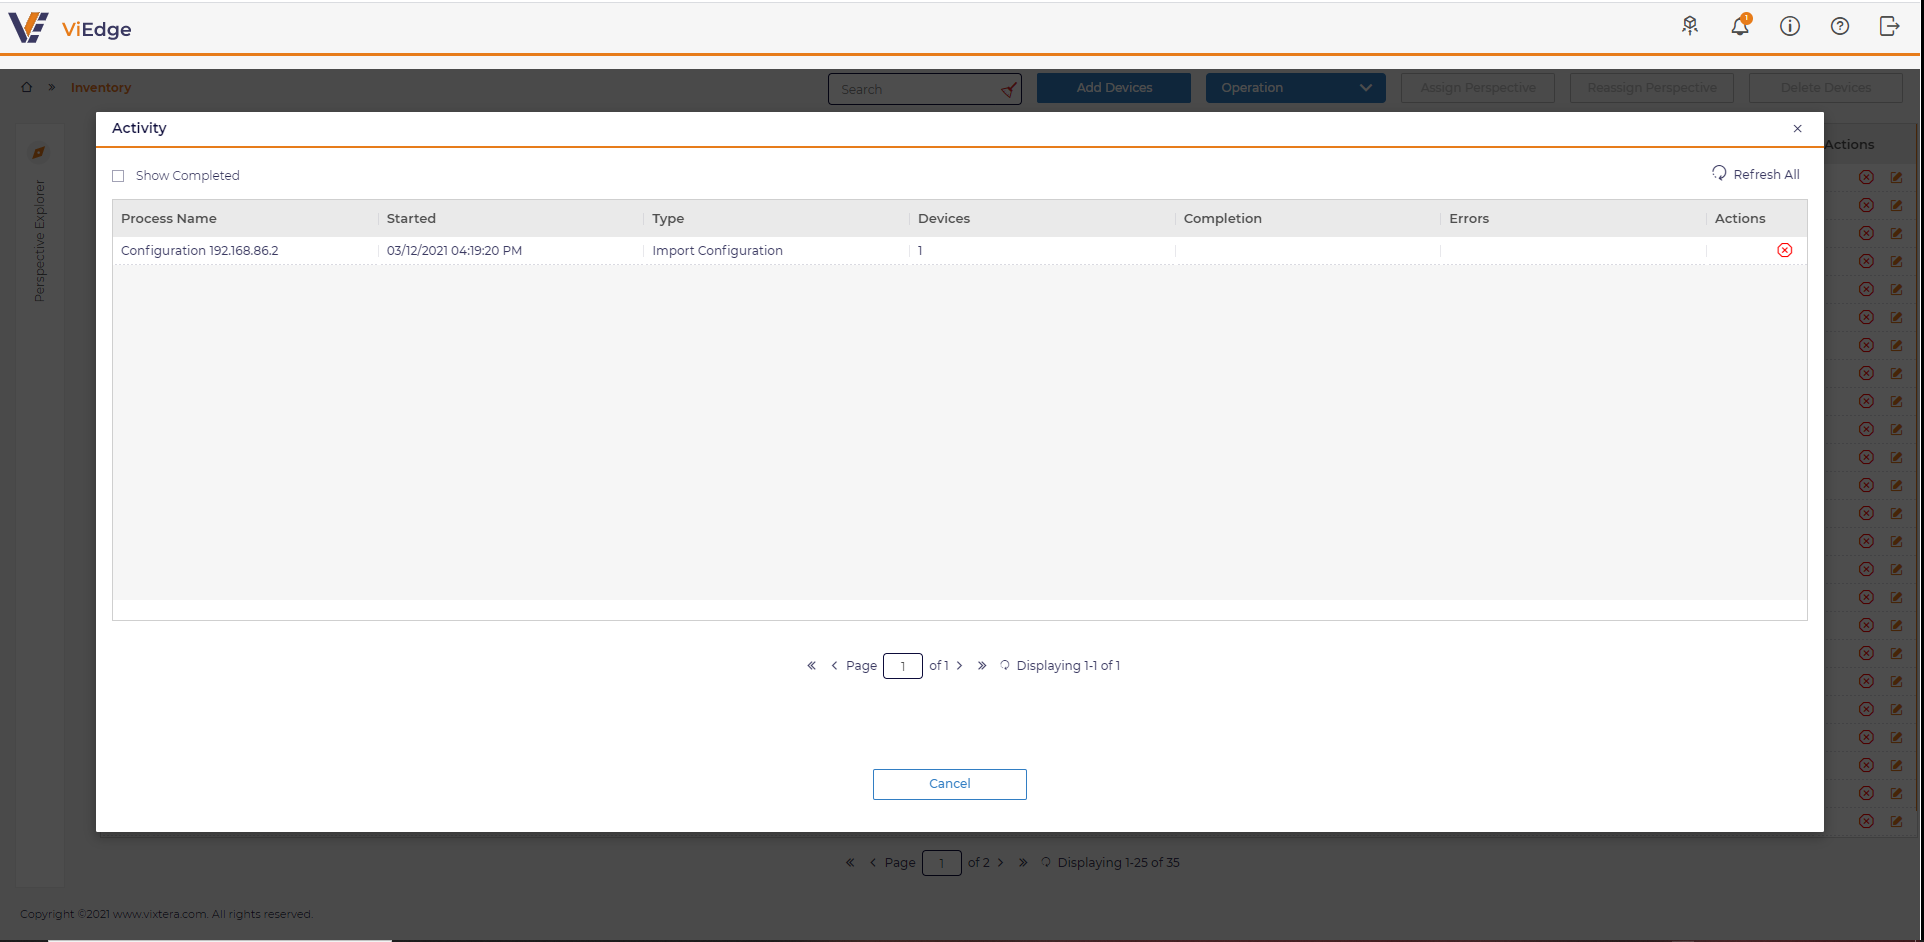
If a process is completed, a record is gone from the Activity view.
To view the completed processes for the last 15 minutes, you should check Show completed option.
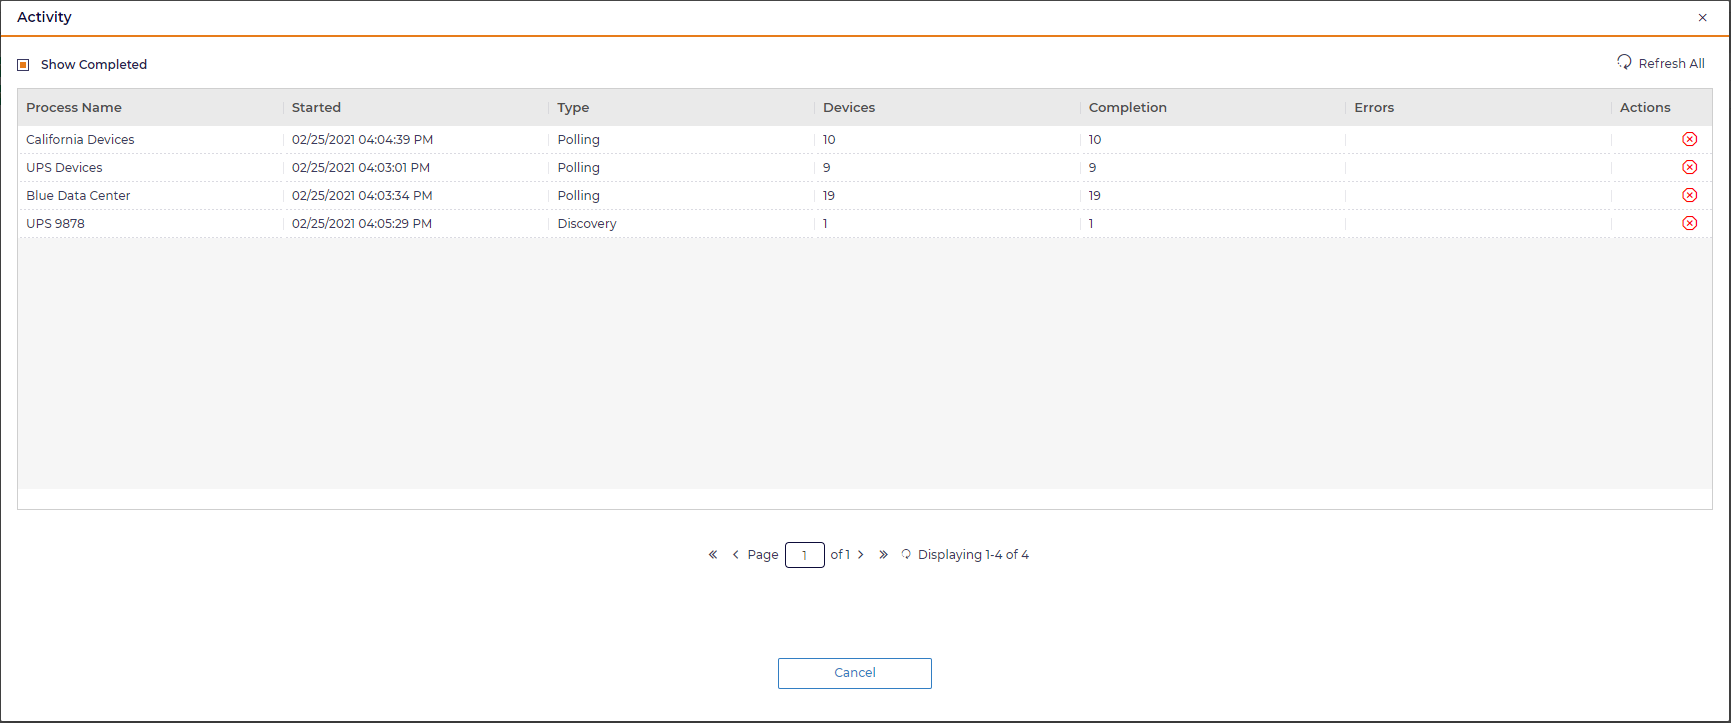
To see the detailed information about the completed processes, you should go to Logs.
A user is able to cancel active process by clicking Cancel action:
